Migration to Australia Driven by Returning Aussies, Departing Yanks and Fewer Poms

There have been many articles published recently concerning high Net Overseas Migration to Australia.
This article looks at recent ABS data on Net Overseas Migration and discusses the changing mix of settlement in Australia by nationality.
Overall Trend
Net overseas migration was 267,000 in 2018-19. After historic highs of close to 300,000 in 2008-09, numbers dropped to 105,000 in 2009-10. Since then, there has been an overall increasing trend.

Trends by Country
The below interactive chart allows you to view the trend for each country for each financial year.
The following data can be viewed:
- Settler Arrivals: Migrants arriving in Australia on a permanent basis from overseas
- Residents: People reporting a residential address in Australia. Net numbers of people arriving or departing on a short-term basis are displayed, as are those arriving/departing on a long-term basis
- Visitors: People not living in Australia. Net short-term and net long-term trend lines are visible
- Total: Net flow of people of each citizenship to Australia each year
Overall Contribution by Country
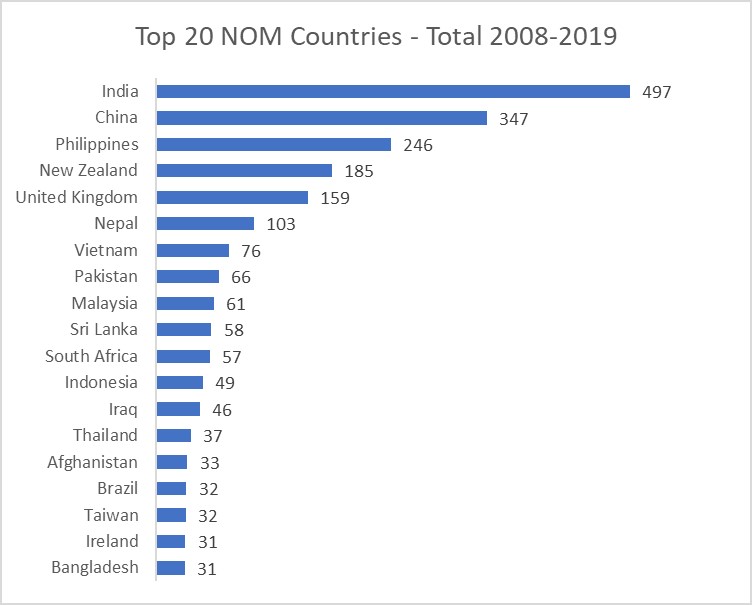
In the past 11 years, the net increase in Australia’s population due to migration was 2.28 million. Of this increase, approximately 500,000 people came from India, 348,000 from China, 246,000 from the Philippines, 185,000 from New Zealand, 159,000 from the UK and 103,000 from Nepal. The chart below lists the top 20 countries over this period – numbers in the charts below are all in thousands of people:
The main outflows were Australians (390,000) and US citizens (27,500) and Japanese (1,600). Whilst it’s not unusual for Australians to spend time overseas, it is surprising that so many US citizens have departed Australia – most of this has occurred since the 2015-16 financial year. This has been driven by a large increase in short-term resident departures, suggesting that this may be due to sponsored employees departing Australia.
Biggest Increases in Flows
The chart below lists the top 10 countries by the increase in NOM in 2018-19 versus 2008-09. That is, the countries where the flow of people to Australia has increased the most:

28,000 more Australians returned home than departed in 2018-19 – this is very much against the usual trend. On average, 35,000 more Australians departed Australia than returned over the 11 year period. This was due to short-term trips so is unlikely to be indicative of a significant trend. It could for instance be a timing issue due to a temporary slowing of growth in the number Australians travelling for tourism. The number of short-term departures of this nature grew from 5.1 million in 2008-09 to 9.5 million in 2018-19.
Apart from Australians, Nepal had the highest growth in annual flows in the last 11 years – more than doubling from from 11,000 per year to 24,000. This is likely due to increased numbers of students from Nepal.
India had the next highest growth, albeit from a much higher base of 64,000 to 76,000. This was likely driven by both increases in student numbers and employer sponsored visa numbers.
Philippines increased annual flows from 18,000 to almost 30,000. In this case, the increase appears to be due to increased number of short-term arrivals not being balanced by short-term departures. This suggests that Philippines are increasingly arriving on visitor visas and applying onshore for further stay in Australia.
Biggest Decreases in Flows
On the other hand, there were large decreases in the inflows for certain countries. The chart below looks at the countries where the flow has decreased significantly between 2008-09 and 2018-19:

The most striking decrease has been arrivals from the UK – historically the main source of migrants to Australia. Net arrivals from the UK went from 28,000 in 2008-09 to under 1,700 in 2018-19. In this case, the decrease is due to a stunning reduction in Settler Arrivals from the UK – 21,500 in 2008-09 decreasing to a mere 4,113 in 2018-19. This is most likely due to the tightening of the requirements for General Skilled and Employer Sponsored Migration over this period.
The number of New Zealanders settling in Australia has also slowed to a trickle – net arrivals decreasing from 27,000 in 2008-09 to 4,000 in 2018-19. This is most likely due to relative economic conditions in Australia vs NZ.
Apart from the UK and NZ, there have been large reductions in flows from Korea, South Africa, Malaysia, Ireland, France, Taiwan and Thailand.
Somewhat concerning is a reduction in net flows from China – from a high of 46,500 in 2016-17 (mostly driven by international education), flows from China had reduced by 40% to less than 28,000 in 2018-19. This suggests that Chinese nationals may be seeking other international education options.
Conclusion
Many recent articles have noted the increase in Net Overseas Migration, and it is true that NOM is currently at a high level. This is masked somewhat by a large contribution by Australian citizens returning home.
However, more detailed analysis shows some interesting trends – for instance the number of people settling from the UK have decreased sharply and is unlikely to increase without changes to visa requirements. US nationals have also been departing Australia in large numbers since the 2015-16 financial year, and the flow of New Zealanders has slowed considerably.
Source countries for settlement are increasingly South and East Asia – with India, China, Nepal, and the Philippines contributing significant numbers.
A decrease in flows from China may indicate that a slowdown in international education may be in the wings.
Sources
data.gov.au – Overseas Arrivals and Departures
Afghanistan Long-term resident -11 -39 -148 -144 -149 -134 -128 -98 -190 -214 -161
Afghanistan Long-term visitor 75 137 135 235 175 145 79 141 -143 -263 -167
Afghanistan Settler 1692 1619 2020 1609 2171 5686 3384 3228 3558 3784 3256
Afghanistan Short-term resident -91 -187 -239 -188 -443 -169 303 -526 -945 -1108 -509
Afghanistan Short-term visitor 335 690 168 269 192 345 246 339 919 1427 1146
Afghanistan Total 2000 2220 1936 1781 1946 5873 3884 3084 3199 3626 3565
Albania Long-term resident -10 -12 -5 -10 -3 5 -6 -10 1 -12 -5
Albania Long-term visitor 40 35 17 14 16 50 48 30 23 -8 1
Albania Settler 125 92 58 84 85 82 58 62 60 63 42
Albania Short-term resident -20 -38 -22 -54 1 -43 -35 -30 -47 -64 -4
Albania Short-term visitor 61 31 47 28 22 46 42 16 36 57 41
Albania Total 196 108 95 62 121 140 107 68 73 36 75
Algeria Long-term resident -1 -5 -5 -2 -2 2 -6 -1 -1 -6 -4
Algeria Long-term visitor 10 10 10 22 30 22 28 18 8 15 25
Algeria Settler 17 21 18 20 15 16 17 19 16 23 16
Algeria Short-term resident -5 -7 -7 -8 -5 -2 2 -15 -6 -11 -3
Algeria Short-term visitor 5 -10 -5 -5 -1 -11 -23 -7 6 4 18
Algeria Total 26 9 11 27 37 27 18 14 23 25 52
Andorra Long-term resident 0 0 0 0 0 0 0 0 0 0 0
Andorra Long-term visitor 0 0 0 0 1 1 1 2 1 -3 3
Andorra Settler 0 0 1 0 0 0 0 0 0 0 0
Andorra Short-term resident 0 0 0 -1 0 0 0 0 -1 -5 -1
Andorra Short-term visitor -1 0 0 -1 2 0 -3 1 4 3 -4
Andorra Total -1 0 1 -2 3 1 -2 3 4 -5 -2
Angola Long-term resident 0 0 0 0 -1 -2 -6 2 -1 0 -2
Angola Long-term visitor 3 6 9 9 13 5 4 1 0 -1 5
Angola Settler 3 3 0 1 0 2 4 3 5 0 2
Angola Short-term resident -4 0 0 -1 2 -3 -5 -5 -1 1 0
Angola Short-term visitor 1 -1 -12 -6 -8 -6 -1 4 8 -6 2
Angola Total 3 8 -3 3 6 -4 -4 5 11 -6 7
Antigua and Barbuda Long-term resident 0 0 0 0 0 0 0 -1 -1 1 -1
Antigua and Barbuda Long-term visitor 0 1 0 -2 3 2 8 0 1 -1 3
Antigua and Barbuda Settler 0 0 0 0 0 2 0 0 1 0 0
Antigua and Barbuda Short-term resident 0 0 0 -1 1 0 0 0 -2 -1 2
Antigua and Barbuda Short-term visitor -1 -2 2 0 3 -6 -2 -1 1 3 -3
Antigua and Barbuda Total -1 -1 2 -3 7 -2 6 -2 0 2 1
Argentina Long-term resident -29 -17 -45 -36 -30 -24 -22 -39 -31 -33 -36
Argentina Long-term visitor 204 191 205 276 387 411 332 532 552 801 1088
Argentina Settler 97 151 96 113 124 116 86 104 72 46 55
Argentina Short-term resident -130 -8 -53 -45 -143 -92 -115 -86 -159 -125 -53
Argentina Short-term visitor -83 -26 -195 50 237 -182 196 -129 138 224 232
Argentina Total 59 291 8 357 575 229 477 382 572 914 1286
Armenia Long-term resident -6 0 -1 0 -4 3 -7 -1 -2 -5 0
Armenia Long-term visitor 3 14 15 15 15 6 17 21 26 11 20
Armenia Settler 25 21 24 22 26 31 22 16 24 16 19
Armenia Short-term resident -8 -14 -9 -11 -11 -2 -8 -18 -19 -8 -30
Armenia Short-term visitor 1 -2 7 -6 10 -1 -3 -6 -10 -12 5
Armenia Total 15 19 36 20 36 37 21 12 19 2 14
Australia Long-term resident -92288 -96712 -97712 -100954 -97049 -101920 -104496 -109531 -112993 -129444 -132054
Australia Long-term visitor 971 950 1024 963 871 799 952 1052 1077 1013 1048
Australia Settler 1603 1510 1837 2012 2192 2087 1784 1713 1426 1710 1540
Australia Short-term resident -161158 -264945 -211490 -225879 -221143 -243715 -249671 -284436 -289437 -260143 -192622
Australia Short-term visitor 247368 265776 273422 275727 277046 293769 311047 340705 357795 366912 350201
Australia Total -3503 -93421 -32919 -48130 -38083 -48980 -40384 -50497 -42132 -19952 28113
Austria Long-term resident -100 -111 -72 -74 -93 -81 -68 -66 -63 -113 -84
Austria Long-term visitor 356 316 280 289 298 260 310 321 314 305 372
Austria Settler 96 94 39 76 70 45 46 32 31 23 25
Austria Short-term resident -90 14 -210 -19 -213 -286 -81 -229 -228 -38 -138
Austria Short-term visitor -243 -340 -54 -209 112 1 -108 -86 -51 -234 -31
Austria Total 19 -27 -17 63 174 -61 99 -28 3 -58 144
Azerbaijan Long-term resident -10 -5 -1 -5 -5 -1 -4 1 -3 -7 -1
Azerbaijan Long-term visitor 27 26 29 23 44 81 71 72 40 34 30
Azerbaijan Settler 12 12 19 16 23 10 10 10 10 12 11
Azerbaijan Short-term resident -10 -13 -15 -10 -18 -18 -16 -18 -2 -3 -11
Azerbaijan Short-term visitor 9 10 5 -9 -3 -42 -31 -17 -30 -1 -9
Azerbaijan Total 28 30 37 15 41 30 30 48 15 35 20
Bahamas Long-term resident -1 -1 0 0 -1 0 0 0 1 1 0
Bahamas Long-term visitor -1 5 2 4 -2 3 3 2 6 1 6
Bahamas Settler 0 1 2 0 0 3 0 0 0 0 0
Bahamas Short-term resident -1 0 -2 1 -3 -1 -1 -2 -1 1 0
Bahamas Short-term visitor 1 6 -4 2 4 -1 -3 -1 3 -1 0
Bahamas Total -2 11 -2 7 -2 4 -1 -1 9 2 6
Bahrain Long-term resident -2 -2 -1 -2 -6 -5 -12 -2 -9 -8 -3
Bahrain Long-term visitor 140 127 88 44 32 43 38 26 42 38 25
Bahrain Settler 2 2 4 5 25 10 10 5 8 4 2
Bahrain Short-term resident -18 -9 -18 -9 -11 -23 -11 -12 -26 3 -38
Bahrain Short-term visitor -120 -134 -56 -47 -95 -30 -20 -25 10 -2 -33
Bahrain Total 2 -16 17 -9 -55 -5 5 -8 25 35 -47
Bangladesh Long-term resident -131 -56 -69 -151 -260 -162 -225 -238 -193 -210 -191
Bangladesh Long-term visitor 1536 1452 1099 1420 1791 2057 2342 2365 2847 3664 3838
Bangladesh Settler 1447 1637 1336 1429 1434 1589 1940 1510 1406 1132 763
Bangladesh Short-term resident -202 -186 -368 -67 -236 -450 -492 -853 -542 -187 -220
Bangladesh Short-term visitor 254 231 -192 -259 104 -138 -325 -256 -360 -884 -1890
Bangladesh Total 2904 3078 1806 2372 2833 2896 3240 2528 3157 3514 2300
Barbados Long-term resident 0 -1 -1 1 0 -1 0 0 0 0 0
Barbados Long-term visitor 5 5 10 7 18 7 11 13 12 7 7
Barbados Settler 0 1 0 0 3 2 3 3 2 0 0
Barbados Short-term resident -5 -4 -18 -6 -5 -5 -9 1 -4 0 -18
Barbados Short-term visitor 9 -1 -6 -4 -2 -9 -7 -16 -13 -9 8
Barbados Total 9 0 -15 -2 14 -6 -2 1 -3 -2 -3
Belarus Long-term resident -10 -7 -2 -1 -9 -9 -5 -13 -8 -4 -11
Belarus Long-term visitor 11 0 30 29 38 28 37 34 47 51 48
Belarus Settler 54 45 42 28 64 91 38 34 44 51 35
Belarus Short-term resident -24 -34 -51 -25 -26 -43 -48 -60 -18 -34 -50
Belarus Short-term visitor 21 45 11 20 26 29 72 3 37 25 38
Belarus Total 52 49 30 51 93 96 94 -2 102 89 60
Belgium Long-term resident -60 -38 -48 -46 -33 -51 -29 -55 -28 -65 -56
Belgium Long-term visitor 435 365 408 584 611 624 566 502 565 680 603
Belgium Settler 68 63 71 87 102 71 62 68 70 63 33
Belgium Short-term resident -291 -258 74 -132 -25 -73 -93 -267 -223 -306 -170
Belgium Short-term visitor -127 213 -554 -70 -103 -263 -181 -129 -142 -201 -223
Belgium Total 24 345 -49 423 552 308 325 119 242 171 187
Belize Long-term resident -2 0 2 1 1 0 -1 0 0 0 0
Belize Long-term visitor 2 2 2 1 4 10 5 8 -1 3 4
Belize Settler 1 0 0 1 2 0 1 0 0 1 4
Belize Short-term resident 3 0 -2 1 -2 0 -1 -1 1 0 -2
Belize Short-term visitor 0 7 -2 2 0 2 -14 2 6 6 -10
Belize Total 4 9 0 6 5 12 -10 9 6 10 -4
Benin Long-term resident 0 0 0 0 -2 0 0 0 0 0 0
Benin Long-term visitor 0 5 4 4 3 2 2 3 -1 0 1
Benin Settler 0 0 1 2 0 0 3 0 0 1 1
Benin Short-term resident 0 0 -1 0 0 0 -1 -1 0 0 0
Benin Short-term visitor 0 11 -5 2 -1 -5 -1 -1 2 1 -2
Benin Total 0 16 -1 8 0 -3 3 1 1 2 0
Bhutan Long-term resident -1 -2 -2 -5 -10 -8 -7 -9 -24 -11 -24
Bhutan Long-term visitor 124 165 224 195 169 756 522 238 582 1295 1578
Bhutan Settler 763 782 1117 866 797 837 279 412 636 352 310
Bhutan Short-term resident -3 1 4 -4 -7 -4 29 -3 4 -12 -11
Bhutan Short-term visitor -38 -27 -72 -64 -54 -19 -70 58 92 142 272
Bhutan Total 845 919 1271 988 895 1562 753 696 1290 1766 2125
Bolivia, Plurinational State of Long-term resident -1 -4 -1 -2 -5 -2 -7 0 -5 -1 2
Bolivia, Plurinational State of Long-term visitor 5 7 19 22 46 43 21 13 17 10 26
Bolivia, Plurinational State of Settler 16 18 22 25 20 9 1 16 7 12 6
Bolivia, Plurinational State of Short-term resident -6 -2 -8 -5 -8 0 2 -22 2 -6 -2
Bolivia, Plurinational State of Short-term visitor -6 -3 -3 1 -29 -20 -34 3 -5 2 10
Bolivia, Plurinational State of Total 8 16 29 41 24 30 -17 10 16 17 42
Bosnia and Herzegovina Long-term resident -15 -9 -13 -25 -26 -16 -14 -5 -14 -11 -25
Bosnia and Herzegovina Long-term visitor 37 26 22 28 15 28 42 55 51 22 19
Bosnia and Herzegovina Settler 121 131 96 112 53 115 132 91 100 72 47
Bosnia and Herzegovina Short-term resident -16 -37 -76 -27 26 -7 -23 -109 -113 -56 -69
Bosnia and Herzegovina Short-term visitor -13 -21 79 4 8 68 29 87 87 68 119
Bosnia and Herzegovina Total 114 90 108 92 76 188 166 119 111 94 91
Botswana Long-term resident -6 -5 -3 -5 -17 -14 -1 -15 -11 -10 -4
Botswana Long-term visitor 131 62 109 118 126 80 31 50 62 66 86
Botswana Settler 26 32 21 29 36 17 13 21 26 19 7
Botswana Short-term resident -9 -26 -20 -38 0 -15 -1 -17 -27 -11 5
Botswana Short-term visitor -149 -101 -126 -101 -89 -68 -64 -29 -25 -35 -51
Botswana Total -7 -38 -19 3 56 0 -22 10 25 29 43
Brazil Long-term resident -106 -146 -121 -178 -141 -127 -111 -120 -107 -110 -194
Brazil Long-term visitor 1446 524 397 814 1246 3624 1903 3299 3122 3444 3498
Brazil Settler 364 539 332 368 327 280 269 274 410 339 327
Brazil Short-term resident -576 -594 -458 -637 -477 -697 -350 -592 -817 -931 -1153
Brazil Short-term visitor 927 -310 251 633 962 -96 1205 1288 4756 3013 1158
Brazil Total 2055 13 401 1000 1917 2984 2915 4149 7365 5755 3636
Brunei Darussalam Long-term resident -13 -17 -1 -22 -14 -14 -13 -26 -1 -14 -15
Brunei Darussalam Long-term visitor 398 436 408 328 287 240 262 263 282 171 175
Brunei Darussalam Settler 12 19 7 15 17 5 11 15 12 19 16
Brunei Darussalam Short-term resident -78 -91 -37 4 -47 27 9 29 -119 -148 -60
Brunei Darussalam Short-term visitor -276 -483 -405 -447 -233 -346 -361 -175 -186 -165 -277
Brunei Darussalam Total 43 -136 -28 -122 10 -88 -92 106 -12 -137 -161
Bulgaria Long-term resident -6 -26 -8 -12 -13 1 -24 -6 -15 -9 -7
Bulgaria Long-term visitor 56 58 66 81 82 92 76 146 112 147 117
Bulgaria Settler 60 65 31 46 43 74 58 55 43 39 25
Bulgaria Short-term resident -30 -69 -35 -7 -92 -44 -78 -78 -63 -79 -26
Bulgaria Short-term visitor 108 111 88 124 264 210 213 210 141 298 -44
Bulgaria Total 188 138 142 232 284 333 245 327 218 396 65
Burkina Faso Long-term resident 0 0 -1 -1 0 0 1 0 0 0 0
Burkina Faso Long-term visitor 2 2 1 0 2 2 2 0 -5 0 1
Burkina Faso Settler 1 1 0 2 1 0 0 1 0 0 0
Burkina Faso Short-term resident 1 -1 0 0 0 0 -1 0 0 0 0
Burkina Faso Short-term visitor -3 0 -1 2 -2 -1 1 1 -1 1 2
Burkina Faso Total 1 2 -1 3 1 1 3 2 -6 1 3
Burundi Long-term resident 0 0 -1 -1 -1 -3 -1 -3 -1 -3 -3
Burundi Long-term visitor -1 -1 0 6 1 10 9 10 6 3 8
Burundi Settler 334 247 119 112 81 103 130 119 104 116 181
Burundi Short-term resident 1 -2 1 -6 6 -2 0 -5 -7 -4 -1
Burundi Short-term visitor 9 1 15 -7 4 4 12 7 7 3 5
Burundi Total 343 245 134 104 91 112 150 128 109 115 190
Cambodia Long-term resident -32 -36 -51 -60 -56 -23 -50 -64 -37 -71 -34
Cambodia Long-term visitor 327 377 355 462 520 660 755 871 1040 1602 1710
Cambodia Settler 690 808 705 704 681 737 674 749 610 723 515
Cambodia Short-term resident -133 -141 -275 -240 -363 -375 -418 -513 -505 -578 -755
Cambodia Short-term visitor -31 128 -95 58 118 -38 128 37 90 41 -277
Cambodia Total 821 1136 639 924 900 960 1089 1080 1198 1717 1159
Cameroon Long-term resident -1 -2 -4 -1 -3 1 3 0 3 0 -2
Cameroon Long-term visitor 11 7 15 21 37 39 21 25 25 14 14
Cameroon Settler 5 17 38 11 3 9 13 14 7 11 7
Cameroon Short-term resident -3 -4 -10 -1 -1 -2 -5 -5 -6 -7 -4
Cameroon Short-term visitor 12 15 8 -2 -7 -17 -14 -4 -9 9 9
Cameroon Total 24 33 47 28 29 30 18 30 20 27 24
Canada Long-term resident -531 -522 -568 -577 -576 -645 -557 -711 -814 -836 -817
Canada Long-term visitor 4561 4381 4917 5602 5366 4624 3880 3758 3977 4438 4679
Canada Settler 900 858 783 912 820 653 660 634 560 481 457
Canada Short-term resident -1433 -1479 -1226 -1729 -1394 -998 -1634 -2194 -2735 -3786 -3290
Canada Short-term visitor -2566 -2619 -2395 -2403 -3247 -2578 -987 -1613 -2183 -2709 -5622
Canada Total 932 619 1511 1805 969 1056 1362 -126 -1195 -2412 -4593
Cape Verde Long-term resident 0 0 0 0 0 0 0 0 0 0 0
Cape Verde Long-term visitor 1 0 0 1 3 1 2 1 1 1 3
Cape Verde Settler 0 0 1 0 2 1 0 0 0 0 0
Cape Verde Short-term resident 0 0 0 0 0 0 -1 0 0 0 -1
Cape Verde Short-term visitor 0 0 0 1 0 -2 -3 -5 -5 -3 -8
Cape Verde Total 1 0 1 2 5 0 -2 -4 -4 -2 -6
Central African Republic Long-term resident 0 1 -1 -1 0 -1 0 0 0 -1 -1
Central African Republic Long-term visitor 0 0 0 0 1 0 0 0 0 0 0
Central African Republic Settler 0 0 2 0 0 1 0 0 0 0 72
Central African Republic Short-term resident 0 -1 1 1 0 2 0 0 0 0 1
Central African Republic Short-term visitor 1 0 0 0 -1 1 1 -1 1 -1 0
Central African Republic Total 1 0 2 0 0 3 1 -1 1 -2 72
Chad Long-term resident 0 0 0 0 0 0 -1 0 0 0 0
Chad Long-term visitor 2 2 2 0 5 4 1 -1 3 2 1
Chad Settler 0 4 6 6 0 0 4 0 0 0 1
Chad Short-term resident 0 -1 1 1 0 0 0 0 0 0 0
Chad Short-term visitor -1 5 -2 6 -4 -6 -4 1 1 1 1
Chad Total 1 10 7 13 1 -2 0 0 4 3 3
Chile Long-term resident -49 -67 -69 -60 -71 -67 -65 -80 -83 -53 -74
Chile Long-term visitor 633 570 621 741 731 639 775 878 955 1225 1506
Chile Settler 161 153 136 122 78 86 54 86 68 48 59
Chile Short-term resident -112 -92 -273 -91 -194 -234 -200 -127 -194 -234 -113
Chile Short-term visitor -5 -619 78 -241 -41 -108 -14 118 -25 581 -357
Chile Total 628 -55 493 471 503 316 550 875 720 1567 1021
China (excludes SARs and Taiwan) Long-term resident -5082 -6530 -6525 -7288 -6574 -7259 -6082 -6225 -8067 -8097 -7885
China (excludes SARs and Taiwan) Long-term visitor 43366 43261 35881 31643 36236 41819 47030 55788 61765 69623 66625
China (excludes SARs and Taiwan) Settler 14934 15829 13671 15758 16811 16744 18067 18352 17455 15315 14669
China (excludes SARs and Taiwan) Short-term resident -15554 -22481 -22746 -24021 -27777 -28357 -35692 -42005 -44890 -46175 -47779
China (excludes SARs and Taiwan) Short-term visitor -6147 -3099 926 3510 6731 14102 11879 18073 20315 1337 2314
China (excludes SARs and Taiwan) Total 31517 26980 21207 19602 25427 37049 35202 43983 46578 32002 27945
Colombia Long-term resident -40 -51 -51 -55 -84 -64 -55 -71 -49 -83 -95
Colombia Long-term visitor 291 -160 -478 -141 -44 -235 -175 188 577 406 1057
Colombia Settler 283 416 331 423 388 280 255 252 228 189 163
Colombia Short-term resident -36 -193 -254 -373 -434 -302 -311 -451 -582 -689 -520
Colombia Short-term visitor 1649 1132 814 1832 1851 1638 1860 2818 3536 3132 4841
Colombia Total 2147 1144 362 1686 1677 1317 1574 2736 3710 2955 5446
Comoros Long-term resident 0 0 0 0 1 -1 0 0 0 0 -1
Comoros Long-term visitor 0 0 0 0 0 1 0 2 3 4 3
Comoros Settler 0 1 1 0 1 1 2 1 0 0 1
Comoros Short-term resident 0 -1 0 0 -2 0 -1 0 0 0 1
Comoros Short-term visitor 1 -1 2 -3 1 -1 -1 -1 -2 -7 -3
Comoros Total 1 -1 3 -3 1 0 0 2 1 -3 1
Congo, Democratic Republic of Long-term resident 0 0 -1 -2 -3 -2 -1 -2 -5 -4 -8
Congo, Democratic Republic of Long-term visitor 4 0 6 11 18 19 13 17 5 15 11
Congo, Democratic Republic of Settler 215 404 357 420 265 578 417 728 367 770 2151
Congo, Democratic Republic of Short-term resident 1 -3 0 1 -7 3 -1 2 2 5 0
Congo, Democratic Republic of Short-term visitor 4 18 3 23 -6 10 4 7 14 4 21
Congo, Democratic Republic of Total 224 419 365 453 267 608 432 752 383 790 2175
Congo, Republic of Long-term resident -1 -1 -1 -1 -2 -2 -3 0 -1 -1 0
Congo, Republic of Long-term visitor 4 3 1 -3 0 -3 4 6 2 3 1
Congo, Republic of Settler 120 136 108 210 44 25 38 10 43 45 20
Congo, Republic of Short-term resident 4 -3 -8 -7 -1 -3 3 -6 1 -5 -4
Congo, Republic of Short-term visitor 7 37 9 7 -1 7 7 16 5 4 0
Congo, Republic of Total 134 172 109 206 40 24 49 26 50 46 17
Costa Rica Long-term resident -3 -1 -7 0 -2 -2 -4 1 -4 -3 -5
Costa Rica Long-term visitor 30 26 14 33 23 34 26 35 41 33 47
Costa Rica Settler 4 8 11 10 12 7 3 4 6 4 4
Costa Rica Short-term resident -27 2 -14 -35 -20 -26 -20 -31 -45 -30 -38
Costa Rica Short-term visitor -18 -22 0 16 -25 14 -6 -10 9 5 14
Costa Rica Total -14 13 4 24 -12 27 -1 -1 7 9 22
Cote d’Ivoire Long-term resident -1 0 0 -1 0 0 -1 0 1 0 0
Cote d’Ivoire Long-term visitor 8 -1 4 5 4 0 4 0 9 5 18
Cote d’Ivoire Settler 12 2 3 16 6 8 4 2 6 1 2
Cote d’Ivoire Short-term resident -5 2 0 0 0 -2 -1 -3 -3 0 -5
Cote d’Ivoire Short-term visitor -3 2 -6 -2 -3 3 0 3 9 13 -20
Cote d’Ivoire Total 11 5 1 18 7 9 6 2 22 19 -5
Croatia Long-term resident -6 -30 -21 -15 -15 -19 -10 -16 -34 -29 -37
Croatia Long-term visitor 75 57 79 89 160 88 144 89 105 60 139
Croatia Settler 98 83 74 99 76 92 92 58 58 42 23
Croatia Short-term resident -58 -63 -50 -33 -83 -27 -117 -81 -28 -11 -82
Croatia Short-term visitor 236 232 260 246 225 240 305 337 291 375 361
Croatia Total 345 278 342 386 363 374 414 387 392 437 404
Cuba Long-term resident -4 -5 -2 -1 -6 -4 3 -3 -9 1 -10
Cuba Long-term visitor 18 5 9 13 10 13 17 8 16 5 19
Cuba Settler 27 28 15 44 49 15 19 13 22 35 16
Cuba Short-term resident -10 -12 -13 -21 -15 -15 -22 -18 -3 -31 -8
Cuba Short-term visitor 8 12 42 -17 44 -18 28 -13 9 11 20
Cuba Total 39 28 51 18 82 -9 45 -13 35 21 37
Curacao Long-term resident 0 -1 0 0 0 0 0 0 0 0 0
Curacao Long-term visitor 0 0 0 0 0 0 0 0 -1 1 0
Curacao Settler 0 1 0 0 0 0 0 0 0 0 0
Curacao Short-term resident 1 1 0 0 0 0 0 0 0 0 0
Curacao Short-term visitor 0 1 1 2 1 0 0 1 1 1 1
Curacao Total 1 2 1 2 1 0 0 1 0 2 1
Cyprus Long-term resident -5 -2 -7 -8 0 -6 -6 -5 -11 -12 -4
Cyprus Long-term visitor 23 19 19 27 59 48 57 32 24 42 35
Cyprus Settler 2 11 9 8 13 25 15 8 10 6 9
Cyprus Short-term resident 13 -45 -35 -31 -9 -49 -55 -10 7 -32 -33
Cyprus Short-term visitor -4 28 -6 12 101 22 -14 -8 -36 -16 46
Cyprus Total 29 11 -20 8 164 40 -3 17 -6 -13 53
Czech Republic Long-term resident -52 -35 -68 -37 -46 -20 -27 -24 -29 -40 -44
Czech Republic Long-term visitor 307 211 208 329 381 323 413 343 460 477 580
Czech Republic Settler 90 67 45 73 65 59 48 36 48 35 29
Czech Republic Short-term resident -179 -84 -193 -101 -115 -111 -113 -188 -198 -33 -172
Czech Republic Short-term visitor 13 -7 -54 -11 78 79 4 -37 -120 -400 -261
Czech Republic Total 179 152 -61 253 363 330 325 130 161 38 132
Denmark Long-term resident -111 -101 -115 -105 -98 -110 -112 -97 -79 -82 -89
Denmark Long-term visitor 407 403 436 491 461 348 427 364 394 447 445
Denmark Settler 66 63 62 66 85 40 49 36 34 29 27
Denmark Short-term resident -7 -256 -133 -151 -240 -485 -188 21 -183 -401 -68
Denmark Short-term visitor -366 -22 -290 -284 -22 211 -168 -70 -133 -182 -389
Denmark Total -11 87 -40 16 186 4 8 254 33 -189 -74
Djibouti Long-term resident 0 0 0 -2 1 -1 0 1 0 0 -1
Djibouti Long-term visitor -1 0 1 0 1 2 -2 2 3 1 -1
Djibouti Settler 3 4 11 13 1 4 2 3 6 1 2
Djibouti Short-term resident 2 0 1 -5 -3 1 -1 -1 1 -1 2
Djibouti Short-term visitor -3 0 7 -2 -2 5 -4 1 -1 -2 2
Djibouti Total 1 4 20 4 -2 11 -5 6 9 -1 4
Dominica Long-term resident 1 0 0 0 0 -2 0 0 0 0 -1
Dominica Long-term visitor 1 0 5 2 0 3 -1 0 1 3 4
Dominica Settler 0 0 0 0 1 3 0 0 1 5 0
Dominica Short-term resident -1 -2 0 0 -1 0 -1 0 -2 -1 -1
Dominica Short-term visitor 0 -1 0 2 3 7 -1 1 3 -1 9
Dominica Total 1 -3 5 4 3 11 -3 1 3 6 11
Dominican Republic Long-term resident -1 0 1 -1 -2 -2 1 -1 -1 2 -3
Dominican Republic Long-term visitor 0 8 4 2 5 11 1 11 12 13 7
Dominican Republic Settler 6 3 6 6 9 8 4 1 5 6 5
Dominican Republic Short-term resident -4 -4 -7 -11 -3 0 -9 -3 -3 -2 -7
Dominican Republic Short-term visitor 0 12 -6 12 -17 2 14 2 -6 11 -5
Dominican Republic Total 1 19 -2 8 -8 19 11 10 7 30 -3
Ecuador Long-term resident -10 -3 -7 -3 -6 -8 -10 -6 -1 -3 -5
Ecuador Long-term visitor 23 56 45 51 194 529 375 191 147 116 84
Ecuador Settler 33 31 22 30 25 23 17 16 18 14 11
Ecuador Short-term resident -10 -2 -8 -4 -19 -22 -20 -21 -12 -19 -31
Ecuador Short-term visitor 19 -11 -5 18 -10 -166 -329 -325 -111 -51 36
Ecuador Total 55 71 47 92 184 356 33 -145 41 57 95
Egypt Long-term resident -53 -129 -38 -62 -117 -160 -184 -218 -179 -187 -153
Egypt Long-term visitor 457 141 209 332 518 452 322 340 416 437 701
Egypt Settler 729 861 701 769 1002 1114 1062 1069 1182 1186 859
Egypt Short-term resident -161 -134 -141 -170 -206 -406 -232 -228 -317 -449 6
Egypt Short-term visitor 3 127 2 146 482 226 23 184 128 18 11
Egypt Total 975 866 733 1015 1679 1226 991 1147 1230 1005 1424
El Salvador Long-term resident -1 -3 0 -4 -1 -4 -5 2 3 -1 -3
El Salvador Long-term visitor 7 9 5 6 -2 13 24 10 6 10 13
El Salvador Settler 46 47 42 28 30 24 23 30 28 38 31
El Salvador Short-term resident -5 -2 -7 -5 -14 -3 -13 -20 -15 -12 -16
El Salvador Short-term visitor 26 21 0 10 22 4 30 -1 20 11 18
El Salvador Total 73 72 40 35 35 34 59 21 42 46 43
Equatorial Guinea Long-term resident 0 0 0 0 0 0 0 0 0 0 0
Equatorial Guinea Long-term visitor 1 1 0 0 1 0 0 0 3 0 0
Equatorial Guinea Settler 0 0 0 0 4 0 0 0 0 0 0
Equatorial Guinea Short-term resident 0 0 0 -1 -4 2 -1 0 0 0 0
Equatorial Guinea Short-term visitor 0 -1 1 0 0 2 1 -1 -1 0 0
Equatorial Guinea Total 1 0 1 -1 1 4 0 -1 2 0 0
Eritrea Long-term resident -4 1 -3 -9 -3 -2 0 -6 -7 -5 -15
Eritrea Long-term visitor 1 -1 2 2 13 5 2 8 9 9 9
Eritrea Settler 225 198 206 417 177 371 517 395 473 552 450
Eritrea Short-term resident -11 -9 -6 2 -2 4 9 -22 -2 -26 -9
Eritrea Short-term visitor 19 23 33 2 9 15 11 26 10 9 14
Eritrea Total 230 212 232 414 194 393 539 401 483 539 449
Estonia Long-term resident 1 -4 1 -11 -10 -14 -21 -12 -26 -11 -17
Estonia Long-term visitor 182 156 39 170 265 163 155 104 256 319 178
Estonia Settler 14 21 10 20 18 31 11 21 20 12 19
Estonia Short-term resident -43 -50 -82 -56 -84 -99 -52 -117 -177 -160 -115
Estonia Short-term visitor 392 212 193 276 382 76 -18 0 195 107 -130
Estonia Total 546 335 161 399 571 156 74 -4 268 267 -65
Ethiopia Long-term resident -13 -11 -11 -20 -15 -28 -7 -9 -15 -16 -48
Ethiopia Long-term visitor 27 28 33 71 95 83 96 90 99 121 111
Ethiopia Settler 694 787 686 764 424 634 718 678 740 581 600
Ethiopia Short-term resident -11 -31 -35 -13 -40 -8 -20 -62 -39 -66 -34
Ethiopia Short-term visitor 62 51 34 67 57 68 26 82 104 52 15
Ethiopia Total 759 824 707 869 521 749 813 779 889 672 644
Fiji Long-term resident -201 -167 -182 -186 -196 -161 -130 -162 -117 -119 -124
Fiji Long-term visitor 906 656 637 608 622 513 363 343 485 473 815
Fiji Settler 1420 1093 929 1003 880 895 660 581 434 351 255
Fiji Short-term resident -1055 -981 -974 -1273 -1294 -1296 -995 -1292 -1151 -1066 -851
Fiji Short-term visitor 1095 1224 986 1219 1329 1525 1172 1290 1662 1618 1674
Fiji Total 2165 1824 1395 1371 1341 1476 1070 760 1313 1257 1769
Finland Long-term resident -47 -18 -10 -31 -61 -54 -37 -66 -38 -50 -50
Finland Long-term visitor 304 322 313 393 366 347 299 284 355 244 312
Finland Settler 53 64 49 64 50 45 48 43 26 31 41
Finland Short-term resident -100 -173 -60 -276 -67 -92 -104 -160 -69 -283 -286
Finland Short-term visitor 15 -55 -306 87 -108 -49 131 -19 -3 85 -144
Finland Total 225 140 -14 237 180 197 337 82 271 27 -127
Former Yugoslav Republic of Macedonia (FYROM) Long-term resident -19 -37 -55 -8 -41 -33 -16 -24 -33 -29 -23
Former Yugoslav Republic of Macedonia (FYROM) Long-term visitor 66 54 65 86 84 143 54 91 89 94 95
Former Yugoslav Republic of Macedonia (FYROM) Settler 319 259 224 153 225 227 157 203 189 177 123
Former Yugoslav Republic of Macedonia (FYROM) Short-term resident -83 -117 -94 -113 8 -24 -102 -81 -79 -52 -85
Former Yugoslav Republic of Macedonia (FYROM) Short-term visitor 125 83 95 127 44 143 128 106 135 88 99
Former Yugoslav Republic of Macedonia (FYROM) Total 408 242 235 245 320 456 221 295 301 278 209
France Long-term resident -209 -270 -306 -227 -284 -300 -261 -363 -326 -413 -339
France Long-term visitor 4607 4390 5611 5696 5369 4307 3989 3569 4449 5232 5157
France Settler 347 377 326 431 370 381 358 316 269 243 206
France Short-term resident -664 -1143 -919 -1151 -1124 -1015 -790 -1371 -1526 -1566 -1268
France Short-term visitor -329 -1295 -3804 -1862 157 -1713 -1836 -1317 -1295 -2282 -3067
France Total 3752 2059 908 2887 4487 1660 1460 833 1571 1214 688
French Guiana Long-term resident 0 0 0 0 0 0 0 0 0 0 0
French Guiana Long-term visitor 0 0 0 0 0 0 0 0 0 0 0
French Guiana Settler 0 0 0 0 0 0 0 0 0 0 0
French Guiana Short-term resident 0 0 0 0 0 0 0 0 0 0 0
French Guiana Short-term visitor 0 1 1 0 1 0 1 0 0 1 0
French Guiana Total 0 1 1 0 1 0 1 0 0 1 0
Gabon Long-term resident 0 -1 0 0 0 0 0 0 1 0 0
Gabon Long-term visitor 0 0 0 3 0 0 1 0 1 -4 1
Gabon Settler 0 0 0 0 1 1 1 1 1 1 1
Gabon Short-term resident -2 1 0 0 0 0 -1 -2 -2 -4 -1
Gabon Short-term visitor 3 2 1 0 1 -1 0 -1 0 5 -1
Gabon Total 1 2 1 3 2 0 1 -2 1 -2 0
Gambia Long-term resident 0 0 0 -2 0 1 2 0 -1 -2 -1
Gambia Long-term visitor 2 3 8 6 5 8 -2 -1 -1 4 1
Gambia Settler 0 3 0 1 3 1 12 1 0 3 1
Gambia Short-term resident 0 -2 1 -3 4 -1 1 0 -2 0 0
Gambia Short-term visitor -8 2 3 0 2 -9 4 -2 1 1 -3
Gambia Total -6 6 12 2 14 0 17 -2 -3 6 -2
Gaza Strip and West Bank Long-term resident 0 0 0 0 0 0 0 0 0 0 0
Gaza Strip and West Bank Long-term visitor 0 0 0 0 0 0 0 0 0 0 0
Gaza Strip and West Bank Settler 0 0 0 0 0 0 0 0 0 0 0
Gaza Strip and West Bank Short-term resident 0 0 0 0 0 0 0 0 0 0 0
Gaza Strip and West Bank Short-term visitor 1 0 0 -1 0 0 0 0 0 1 0
Gaza Strip and West Bank Total 1 0 0 -1 0 0 0 0 0 1 0
Georgia Long-term resident 1 -5 2 -2 -2 -3 0 -2 0 -1 -3
Georgia Long-term visitor 1 -3 0 9 35 25 6 17 7 29 19
Georgia Settler 10 18 3 8 6 8 12 8 6 4 15
Georgia Short-term resident 1 -5 -3 -5 -7 1 -4 -8 -5 -4 -5
Georgia Short-term visitor 5 19 15 30 1 16 13 32 10 7 -12
Georgia Total 18 24 17 40 33 47 27 47 18 35 14
Germany Long-term resident -671 -679 -657 -672 -676 -691 -647 -610 -613 -706 -624
Germany Long-term visitor 4260 4024 3624 3985 3790 3132 2927 2485 2874 3642 3191
Germany Settler 850 888 607 779 609 499 461 334 366 270 258
Germany Short-term resident -1089 -1382 -687 -815 -1527 -1197 -1503 -1642 -1904 -1764 -1169
Germany Short-term visitor -2181 -1620 -1680 -2660 298 -2279 1198 -105 824 -1791 -2907
Germany Total 1169 1231 1207 617 2494 -536 2435 462 1548 -350 -1251
Ghana Long-term resident -7 -8 -13 3 -7 -19 -8 -5 -15 -6 -28
Ghana Long-term visitor 62 77 69 147 166 162 163 197 245 226 191
Ghana Settler 103 195 139 189 189 150 159 159 154 104 132
Ghana Short-term resident -56 0 -90 -46 -40 -77 -61 -79 -31 -51 -57
Ghana Short-term visitor 47 15 83 -2 59 -2 91 11 -2 107 54
Ghana Total 149 279 188 291 367 214 344 283 351 379 292
Greece Long-term resident -35 -42 -43 -29 -34 -49 -87 -98 -106 -109 -95
Greece Long-term visitor 97 171 108 283 334 255 42 114 94 12 22
Greece Settler 77 62 69 170 292 225 111 99 78 78 41
Greece Short-term resident -51 -156 -45 -38 -149 -167 -216 -240 -194 -237 -295
Greece Short-term visitor 118 352 439 1149 945 696 741 946 821 692 705
Greece Total 206 387 528 1535 1387 959 590 821 693 436 378
Grenada Long-term resident 0 -2 -2 0 0 -1 0 0 0 0 -2
Grenada Long-term visitor 2 0 2 7 4 6 2 6 3 15 2
Grenada Settler 0 0 0 0 0 1 0 0 1 0 8
Grenada Short-term resident -4 -1 1 2 -1 1 -1 1 0 -1 -3
Grenada Short-term visitor 3 4 6 -1 3 -2 -2 0 -2 5 -6
Grenada Total 1 1 7 8 6 5 -1 7 2 19 -1
Guatemala Long-term resident -2 -4 1 0 -4 -1 3 -3 -5 0 -1
Guatemala Long-term visitor 9 0 9 5 21 14 26 22 27 22 38
Guatemala Settler 10 5 8 12 15 10 4 6 5 6 6
Guatemala Short-term resident -3 -8 -1 -3 -11 -4 -1 -10 -2 1 -14
Guatemala Short-term visitor -19 8 -12 -6 0 6 5 -5 -16 1 11
Guatemala Total -5 1 5 8 21 25 37 10 9 30 40
Guinea Long-term resident 0 0 -1 0 -2 0 0 0 -1 -2 -2
Guinea Long-term visitor 4 -2 -4 4 1 10 5 3 5 6 4
Guinea Settler 12 51 16 32 22 20 13 19 50 26 14
Guinea Short-term resident -2 -4 -5 0 -1 -7 0 -5 -3 1 -4
Guinea Short-term visitor 5 -1 12 5 3 5 2 1 5 -3 -2
Guinea Total 19 44 18 41 23 28 20 18 56 28 10
Guinea-Bissau Long-term resident 0 0 0 0 0 0 0 0 0 0 0
Guinea-Bissau Long-term visitor 1 0 0 -1 0 -2 0 1 1 1 0
Guinea-Bissau Settler 0 0 1 0 0 0 0 0 0 0 0
Guinea-Bissau Short-term resident 0 0 0 0 1 0 0 0 0 1 0
Guinea-Bissau Short-term visitor 4 -2 1 -1 0 1 0 -1 -1 -1 0
Guinea-Bissau Total 5 -2 2 -2 1 -1 0 0 0 1 0
Guyana Long-term resident 0 -1 -1 0 -3 -1 -2 0 -1 0 0
Guyana Long-term visitor 7 0 8 3 4 6 4 3 -1 5 2
Guyana Settler 3 2 1 6 3 2 0 2 2 0 0
Guyana Short-term resident -1 -2 1 -2 1 -1 -2 -1 1 2 -1
Guyana Short-term visitor 2 6 -7 8 9 15 14 5 3 9 12
Guyana Total 11 5 2 15 14 21 14 9 4 16 13
Haiti Long-term resident 0 0 0 0 0 -1 0 -1 0 -1 -1
Haiti Long-term visitor 2 3 3 -1 2 5 0 -1 -1 1 0
Haiti Settler 1 3 0 0 2 8 3 2 3 1 0
Haiti Short-term resident 0 -1 0 0 0 -3 -1 -4 2 -1 -1
Haiti Short-term visitor 0 13 -15 -1 0 6 3 -3 5 3 7
Haiti Total 3 18 -12 -2 4 15 5 -7 9 3 5
Holy See Long-term resident 0 0 0 0 0 0 0 0 0 0 0
Holy See Long-term visitor 1 1 0 1 2 0 3 1 1 2 1
Holy See Settler 0 0 0 0 0 0 0 0 0 0 0
Holy See Short-term resident 0 0 0 0 7 7 0 0 0 0 0
Holy See Short-term visitor 95 14 2 7 14 15 7 21 0 18 32
Holy See Total 96 15 2 8 24 21 10 22 1 20 33
Honduras Long-term resident -1 1 -2 1 -1 0 -2 0 1 0 -1
Honduras Long-term visitor 2 11 8 9 10 30 14 2 13 13 18
Honduras Settler 4 3 4 2 10 5 5 3 3 1 8
Honduras Short-term resident 0 -5 2 -3 -8 -4 2 -9 -4 -5 -1
Honduras Short-term visitor -2 -2 -3 -2 9 10 14 4 20 27 25
Honduras Total 3 8 9 7 20 41 33 0 33 36 49
Hong Kong (SAR of China) Long-term resident -348 -315 -313 -321 -297 -293 -305 -338 -390 -521 -506
Hong Kong (SAR of China) Long-term visitor 5588 5646 5472 4310 4626 4156 3399 3504 3702 4486 4547
Hong Kong (SAR of China) Settler 749 650 527 634 711 693 751 942 993 993 1095
Hong Kong (SAR of China) Short-term resident -1121 -1057 -1546 -857 -1159 -1323 -1609 -2024 -2162 -2332 -2803
Hong Kong (SAR of China) Short-term visitor -2486 -2189 -2787 -888 315 326 -1210 -1411 -2042 -1992 -1415
Hong Kong (SAR of China) Total 2382 2734 1353 2878 4196 3558 1026 673 101 634 918
Hungary Long-term resident -15 -28 -12 -26 -15 -16 -33 -51 -36 -31 -37
Hungary Long-term visitor 339 223 193 226 400 263 263 265 243 215 227
Hungary Settler 147 153 112 188 185 144 146 117 94 68 36
Hungary Short-term resident -41 -110 -139 -119 -116 -166 -241 -51 -186 -254 -86
Hungary Short-term visitor -73 8 20 148 88 69 144 114 112 96 -78
Hungary Total 357 246 174 417 542 294 279 394 227 94 62
Iceland Long-term resident -1 -2 -2 -7 -7 -2 -2 -1 2 -9 -3
Iceland Long-term visitor 14 10 8 21 25 17 16 14 31 31 17
Iceland Settler 4 4 1 8 6 2 1 3 4 7 1
Iceland Short-term resident -23 -31 -59 -28 -14 -8 4 -59 -33 -17 -12
Iceland Short-term visitor -44 1 35 2 14 4 -33 7 5 -16 -30
Iceland Total -50 -18 -17 -4 24 13 -14 -36 9 -4 -27
India Long-term resident -3356 -3189 -2752 -3260 -3042 -3806 -3151 -3597 -4250 -3563 -2694
India Long-term visitor 59518 22407 3238 15601 22117 32960 34412 33236 38620 48540 67366
India Settler 16905 15332 9945 13176 17254 19331 19958 20470 23257 21006 17039
India Short-term resident -2588 -3279 -2658 -3394 -6437 -7067 -6860 -8372 -7541 -8103 -4934
India Short-term visitor -6816 -4175 2035 859 545 659 4214 8015 7074 11040 -428
India Total 63662 27097 9808 22982 30437 42077 48573 49752 57160 68921 76349
Indonesia Long-term resident -1258 -1361 -1136 -1405 -1103 -1104 -757 -781 -1042 -867 -628
Indonesia Long-term visitor 7760 7721 7738 8295 7846 7741 7775 7506 8202 9070 9819
Indonesia Settler 1665 1431 1325 1356 1200 1144 1015 937 733 548 412
Indonesia Short-term resident -3108 -4138 -3268 -3515 -3269 -3625 -3448 -4509 -3702 -4659 -3287
Indonesia Short-term visitor -767 -120 -2128 -2096 -920 -1277 854 5576 7002 -6885 740
Indonesia Total 4293 3533 2531 2635 3754 2879 5440 8728 11193 -2793 7056
Iran Long-term resident -184 -205 -314 -311 -317 -374 -540 -480 -516 -439 -216
Iran Long-term visitor 1247 1473 1932 2246 2375 1819 1761 1541 1782 1943 1800
Iran Settler 1825 1615 2150 2607 2593 2250 2750 1996 1960 1738 1815
Iran Short-term resident -335 -206 -312 -550 -480 -663 -792 -772 -842 -906 -665
Iran Short-term visitor -735 -430 -540 -436 -498 -822 -44 109 17 229 145
Iran Total 1818 2247 2916 3555 3673 2210 3135 2394 2401 2565 2879
Iraq Long-term resident -16 -75 -132 -175 -120 -60 21 -61 -119 -99 -121
Iraq Long-term visitor 368 480 349 218 436 890 832 208 116 -27 16
Iraq Settler 4027 2443 2904 1931 3134 3940 3099 3049 9680 3699 6287
Iraq Short-term resident -235 -164 -38 -99 -64 -94 -77 -119 -267 -406 -356
Iraq Short-term visitor 179 67 -52 5 43 64 61 173 208 263 268
Iraq Total 4323 2751 3031 1880 3429 4740 3936 3250 9618 3430 6094
Ireland Long-term resident -520 -505 -482 -659 -694 -864 -1082 -1272 -1146 -1001 -960
Ireland Long-term visitor 4287 3321 7225 15896 15915 11446 7782 5962 5275 6065 6312
Ireland Settler 1654 1639 1391 2413 1808 1421 1192 943 663 545 403
Ireland Short-term resident -965 -992 -936 -1881 -2177 -2459 -2153 -2220 -1884 -1597 -1219
Ireland Short-term visitor 1710 -2244 2548 -2000 -7133 -15657 -9578 -5511 -2363 -1677 -2921
Ireland Total 6166 1219 9746 13769 7719 -6113 -3839 -2097 545 2335 1615
Israel Long-term resident -59 -96 -105 -48 -91 -67 -80 -50 -72 -74 -57
Israel Long-term visitor 626 454 447 439 493 380 430 462 585 503 526
Israel Settler 323 372 226 243 311 264 229 207 255 206 149
Israel Short-term resident -239 -133 -223 57 -184 -123 -45 -240 -184 -107 -77
Israel Short-term visitor -621 -456 -339 -559 -275 -115 -302 -95 260 -534 -421
Israel Total 30 141 6 132 254 339 232 283 844 -6 120
Italy Long-term resident -195 -208 -206 -220 -199 -204 -217 -266 -286 -333 -344
Italy Long-term visitor 1472 1410 1782 2359 3593 3610 3064 2833 3261 3337 3421
Italy Settler 226 269 221 342 318 304 251 297 271 234 199
Italy Short-term resident -374 -673 -681 -609 -717 -880 -943 -1127 -1448 -1259 -1673
Italy Short-term visitor 469 769 371 2348 3214 1432 128 -529 -201 -1172 -507
Italy Total 1597 1567 1487 4220 6209 4262 2283 1208 1597 807 1097
Jamaica Long-term resident -2 -7 -1 -5 -2 0 -3 -2 -4 1 -6
Jamaica Long-term visitor 9 15 45 30 37 34 11 9 21 27 18
Jamaica Settler 17 12 5 9 22 12 16 14 11 12 9
Jamaica Short-term resident -8 -15 -13 -10 -2 -5 -18 -9 -14 -9 -16
Jamaica Short-term visitor 31 28 3 39 45 32 78 36 42 75 56
Jamaica Total 47 33 39 63 100 73 84 48 56 106 61
Japan Long-term resident -816 -891 -765 -754 -707 -784 -752 -834 -685 -783 -680
Japan Long-term visitor 4265 4439 4390 4914 5696 5650 5046 5208 5580 5997 6765
Japan Settler 695 527 424 551 561 365 303 325 272 195 178
Japan Short-term resident -2244 -3393 -1058 -1248 -1851 -1707 -2268 -3618 -2893 -1252 -2236
Japan Short-term visitor -4705 -486 -4212 -2706 -2947 -3298 -1160 390 -3287 -4893 -4411
Japan Total -2806 196 -1221 757 751 226 1168 1471 -1013 -735 -385
Jordan Long-term resident -47 -68 -18 -49 -32 -74 -38 -59 -108 -77 -22
Jordan Long-term visitor 105 150 117 228 270 201 148 141 216 209 275
Jordan Settler 274 213 199 247 268 314 326 359 420 333 174
Jordan Short-term resident -97 1 -88 -114 -64 -59 -199 -177 -201 -68 -88
Jordan Short-term visitor 40 -51 -8 5 46 49 26 149 33 64 -9
Jordan Total 275 245 202 317 488 431 263 413 360 461 330
Kazakhstan Long-term resident -5 -18 -19 -16 -14 -20 -13 -6 -15 -6 -5
Kazakhstan Long-term visitor 82 124 139 194 191 190 184 162 98 149 204
Kazakhstan Settler 83 44 46 72 91 54 78 54 76 69 41
Kazakhstan Short-term resident -8 -36 -64 -61 -78 -49 -102 -114 -91 -26 -22
Kazakhstan Short-term visitor -91 -61 -63 -102 -94 -86 -74 -59 21 -99 -121
Kazakhstan Total 61 53 39 87 96 89 73 37 89 87 97
Kenya Long-term resident -57 -66 -70 -69 -71 -62 -49 -65 -13 -53 -39
Kenya Long-term visitor 730 704 337 286 494 603 662 863 1260 1049 949
Kenya Settler 289 269 227 261 227 191 368 281 264 228 185
Kenya Short-term resident -270 -287 -23 -95 -206 -51 -88 -56 -250 -287 -193
Kenya Short-term visitor -32 137 -174 38 165 -15 -22 -53 208 182 8
Kenya Total 660 757 297 421 609 666 871 970 1469 1119 910
Kiribati Long-term resident -2 -4 -4 -5 -6 -3 2 -2 -8 -5 -1
Kiribati Long-term visitor 38 74 -19 -8 -2 35 16 9 85 104 79
Kiribati Settler 5 14 3 2 4 0 7 7 18 6 1
Kiribati Short-term resident -17 -2 4 -30 -13 -6 -15 -62 -55 -91 -15
Kiribati Short-term visitor 17 -12 -30 -2 -1 -63 -11 13 122 151 -17
Kiribati Total 41 70 -46 -43 -18 -37 -1 -35 162 165 47
Korea, Democratic People’s Republic of (North) Long-term resident 0 0 -1 0 0 0 0 0 0 0 0
Korea, Democratic People’s Republic of (North) Long-term visitor 3 0 0 0 0 0 0 0 0 0 0
Korea, Democratic People’s Republic of (North) Settler 0 3 0 0 0 0 0 0 0 0 0
Korea, Democratic People’s Republic of (North) Short-term resident 0 0 1 0 1 0 1 0 0 0 0
Korea, Democratic People’s Republic of (North) Short-term visitor 13 3 0 4 0 3 2 0 0 1 1
Korea, Democratic People’s Republic of (North) Total 16 6 0 4 1 3 3 0 0 1 1
Korea, Republic of (South) Long-term resident -875 -785 -824 -722 -841 -747 -612 -557 -487 -462 -475
Korea, Republic of (South) Long-term visitor 7424 4492 2060 2067 2614 1701 1992 1890 2976 3213 3029
Korea, Republic of (South) Settler 2608 2296 1783 2050 1919 986 823 647 608 452 367
Korea, Republic of (South) Short-term resident -2641 -2972 -1981 -2967 -2307 -3133 -1533 -2842 -2333 -2156 -2856
Korea, Republic of (South) Short-term visitor 2221 -2012 -1910 3639 4748 -1506 3044 2933 2993 429 56
Korea, Republic of (South) Total 8737 1018 -873 4067 6133 -2699 3714 2072 3757 1476 121
Kosovo Long-term resident -2 -3 -3 -6 -3 -8 -3 -2 -5 -6 -4
Kosovo Long-term visitor -3 0 6 5 8 2 11 9 1 8 4
Kosovo Settler 6 22 16 22 25 22 18 21 39 22 4
Kosovo Short-term resident -1 -4 -15 2 -5 -13 -7 -15 -17 -25 -7
Kosovo Short-term visitor 6 15 2 6 20 4 6 18 4 17 16
Kosovo Total 6 30 6 29 45 7 25 31 22 16 13
Kuwait Long-term resident -2 0 -2 -3 -1 -5 -2 -7 -1 -6 -5
Kuwait Long-term visitor 186 467 789 1222 1362 1215 1014 780 684 481 316
Kuwait Settler 2 3 6 13 3 10 11 4 8 16 5
Kuwait Short-term resident -4 -6 -4 -21 -12 -33 -19 -33 -15 -3 -46
Kuwait Short-term visitor -88 -170 -460 -810 -1746 -1291 -1052 -712 -643 -721 -381
Kuwait Total 94 294 329 401 -394 -104 -48 32 33 -233 -111
Kyrgyzstan Long-term resident -2 -4 0 -6 -8 0 -1 -4 -6 1 -8
Kyrgyzstan Long-term visitor 0 10 16 5 18 9 10 4 8 9 24
Kyrgyzstan Settler 25 28 18 14 20 11 18 20 19 11 13
Kyrgyzstan Short-term resident -11 -2 -19 -2 -6 -14 -13 -13 -13 -21 -12
Kyrgyzstan Short-term visitor 13 2 11 -7 -2 7 22 5 14 17 31
Kyrgyzstan Total 25 34 26 4 22 13 36 12 22 17 48
Laos Long-term resident 2 -12 -9 1 -13 -18 -17 0 -8 -12 -8
Laos Long-term visitor 121 149 110 122 148 145 153 154 185 196 254
Laos Settler 75 47 290 116 48 67 52 68 34 32 26
Laos Short-term resident -45 -56 -39 -43 -75 -80 -33 -55 -50 -14 -86
Laos Short-term visitor -59 5 -148 -66 18 26 -21 -58 -31 -53 42
Laos Total 94 133 204 130 126 140 134 109 130 149 228
Latvia Long-term resident -4 -9 -1 -14 -3 -4 2 -7 -14 -1 0
Latvia Long-term visitor 41 49 37 41 56 25 22 27 36 35 65
Latvia Settler 30 35 20 45 17 15 10 17 11 8 9
Latvia Short-term resident -27 -34 -25 -54 -48 -57 -8 -26 -42 -56 -24
Latvia Short-term visitor 84 43 30 35 53 117 39 73 117 93 18
Latvia Total 124 84 61 53 75 96 65 84 108 79 68
Lebanon Long-term resident -240 -259 -151 -193 -127 -108 -135 -186 -152 -172 -146
Lebanon Long-term visitor 278 302 178 226 431 376 329 196 273 280 309
Lebanon Settler 1115 967 859 1166 799 914 912 751 820 1037 654
Lebanon Short-term resident -692 -144 -388 -404 -148 -334 -399 -561 -461 -603 -325
Lebanon Short-term visitor 142 802 71 477 397 408 600 527 458 509 695
Lebanon Total 603 1668 569 1272 1352 1256 1307 727 938 1051 1187
Lesotho Long-term resident -1 0 0 2 0 0 0 0 0 1 -1
Lesotho Long-term visitor 14 2 5 11 13 11 14 7 3 1 8
Lesotho Settler 0 3 2 0 1 2 0 0 1 0 1
Lesotho Short-term resident -1 1 -4 0 -1 0 -2 -1 0 -1 -1
Lesotho Short-term visitor -6 -10 -10 -4 -8 -13 -13 -13 -11 1 -2
Lesotho Total 6 -4 -7 9 5 0 -1 -7 -7 2 5
Liberia Long-term resident 0 0 0 -2 -2 -3 -1 0 -4 -3 -2
Liberia Long-term visitor -1 5 10 21 7 24 10 -6 10 6 5
Liberia Settler 414 473 144 171 97 164 113 80 157 47 41
Liberia Short-term resident -1 -4 -4 0 -3 0 -12 -2 -7 -4 -15
Liberia Short-term visitor 12 8 15 1 7 -9 -11 7 -1 10 4
Liberia Total 424 482 165 191 106 176 99 79 155 56 33
Libya Long-term resident 0 -5 1 -3 1 1 3 -1 -6 -7 -6
Libya Long-term visitor 236 435 676 -23 -28 -230 -37 -11 -12 2 36
Libya Settler 2 3 5 1 2 2 9 15 9 4 4
Libya Short-term resident -1 6 -4 -2 1 1 0 5 0 -8 13
Libya Short-term visitor 7 -78 -90 -140 -93 -37 -52 -20 -5 -11 -4
Libya Total 244 361 588 -167 -117 -263 -77 -12 -14 -20 43
Liechtenstein Long-term resident 0 1 0 0 -1 0 -1 0 1 0 -1
Liechtenstein Long-term visitor 0 4 1 6 1 1 -1 0 0 -1 -1
Liechtenstein Settler 2 0 0 2 0 0 0 0 0 0 0
Liechtenstein Short-term resident -10 -16 -7 -7 -2 -3 3 3 -1 -5 -2
Liechtenstein Short-term visitor 8 16 -8 -10 1 2 -15 7 -1 -12 8
Liechtenstein Total 0 5 -13 -9 -1 0 -14 10 -1 -18 4
Lithuania Long-term resident -4 -15 -9 -4 -10 -9 -6 -8 -19 -10 -19
Lithuania Long-term visitor 26 71 106 103 140 155 172 216 293 250 276
Lithuania Settler 28 34 30 48 34 16 25 27 26 23 12
Lithuania Short-term resident -22 -29 -26 -38 -34 -48 -47 -43 -60 -51 -53
Lithuania Short-term visitor 26 27 58 43 -18 60 14 -38 -61 -47 -107
Lithuania Total 54 88 159 152 112 174 158 154 179 165 109
Luxembourg Long-term resident 0 -1 -5 -1 -3 0 3 -3 -4 2 -7
Luxembourg Long-term visitor 8 16 2 8 6 9 12 23 23 25 16
Luxembourg Settler 0 1 0 1 5 2 2 1 3 0 2
Luxembourg Short-term resident -38 -46 -17 -21 -15 -7 -13 -54 -22 -12 -40
Luxembourg Short-term visitor 9 38 -17 7 -8 3 -17 20 -7 -9 25
Luxembourg Total -21 8 -37 -6 -15 7 -13 -13 -7 6 -4
Macau (SAR of China) Long-term resident -6 -3 -8 -3 -1 -11 -13 -2 -16 -25 -23
Macau (SAR of China) Long-term visitor 219 209 185 131 88 81 103 205 301 245 299
Macau (SAR of China) Settler 21 20 20 15 25 43 33 49 33 50 41
Macau (SAR of China) Short-term resident -17 -23 -12 -23 -28 -53 -44 -64 -114 -152 -182
Macau (SAR of China) Short-term visitor -39 -129 -109 -22 8 65 388 270 -27 -16 1
Macau (SAR of China) Total 178 74 76 98 92 125 467 458 177 102 136
Madagascar Long-term resident 0 0 0 1 0 0 1 0 0 -4 -1
Madagascar Long-term visitor 7 1 3 7 13 6 5 2 14 19 29
Madagascar Settler 0 1 7 2 0 4 1 9 0 3 2
Madagascar Short-term resident -1 -1 1 -4 -2 -1 -3 -3 0 -5 5
Madagascar Short-term visitor -7 9 -13 -4 -6 -6 3 5 -7 -10 -15
Madagascar Total -1 10 -2 2 5 3 7 13 7 3 20
Malawi Long-term resident 4 -4 -2 -1 -3 0 -3 4 0 -2 -1
Malawi Long-term visitor 49 36 43 44 63 16 19 26 34 46 30
Malawi Settler 6 9 7 10 11 15 9 4 5 4 5
Malawi Short-term resident -7 4 -5 -4 -4 3 -10 -5 -6 0 -6
Malawi Short-term visitor -19 -29 -19 -21 -32 -28 -30 -11 -13 -20 -28
Malawi Total 33 16 24 28 35 6 -15 18 20 28 0
Malaysia Long-term resident -1514 -1831 -1809 -1816 -1876 -1736 -1569 -1046 -1516 -1212 -1187
Malaysia Long-term visitor 12267 12727 11695 10606 10371 9342 9487 9825 9308 8247 6813
Malaysia Settler 3259 3390 2627 3566 3339 2336 2127 2228 2419 1876 1208
Malaysia Short-term resident -4928 -5898 -5763 -6479 -6358 -6556 -5792 -6719 -8412 -5940 -5337
Malaysia Short-term visitor -3140 -4121 -3026 -817 -621 83 1676 8237 10232 376 -1915
Malaysia Total 5944 4267 3724 5059 4856 3470 5929 12525 12031 3347 -417
Maldives Long-term resident 1 -6 -5 -4 -5 -4 -9 -3 -6 3 -2
Maldives Long-term visitor 122 153 145 143 163 174 178 127 133 109 137
Maldives Settler 10 25 1 12 20 14 18 17 13 6 10
Maldives Short-term resident -9 -3 1 -15 -13 -36 -10 -65 -37 16 -22
Maldives Short-term visitor -105 -175 -127 -97 -141 -112 -140 -81 -115 -108 -127
Maldives Total 19 -6 15 39 24 36 37 -5 -12 26 -4
Mali Long-term resident 1 -1 0 0 -1 -2 -1 1 0 -1 -1
Mali Long-term visitor 2 0 5 5 0 -1 4 3 2 4 1
Mali Settler 0 3 2 3 7 5 0 0 1 2 0
Mali Short-term resident -1 1 1 0 -1 -1 2 0 0 -7 0
Mali Short-term visitor 1 1 -3 -2 3 -4 -1 -3 -3 1 3
Mali Total 3 4 5 6 8 -3 4 1 0 -1 3
Malta Long-term resident -21 -23 -44 -12 -22 -18 -13 -27 -14 -14 -12
Malta Long-term visitor 7 10 31 36 31 24 27 15 16 50 56
Malta Settler 51 29 35 26 27 14 17 15 10 5 10
Malta Short-term resident -65 -98 24 -74 -77 -65 -51 -29 -71 -17 -45
Malta Short-term visitor 52 35 22 52 79 26 17 32 65 -48 21
Malta Total 24 -47 68 28 38 -19 -3 6 6 -25 30
Marshall Islands Long-term resident 0 0 0 1 0 0 0 0 0 -2 -1
Marshall Islands Long-term visitor -9 3 -1 -2 1 -5 -1 -14 1 -2 -2
Marshall Islands Settler 0 0 1 0 0 0 0 1 0 0 0
Marshall Islands Short-term resident 0 0 0 -1 0 -1 0 -3 1 1 0
Marshall Islands Short-term visitor 13 -3 1 6 -5 5 -5 2 16 -4 -2
Marshall Islands Total 4 0 1 4 -4 -1 -6 -14 18 -7 -5
Mauritania Long-term resident 0 1 -1 0 0 1 0 -1 0 1 0
Mauritania Long-term visitor -1 0 -1 0 0 0 2 0 1 0 1
Mauritania Settler 0 0 0 1 0 0 0 0 2 0 0
Mauritania Short-term resident 0 -1 1 0 -1 -1 0 1 -1 0 -1
Mauritania Short-term visitor -4 -1 1 1 3 -3 5 -1 0 0 -1
Mauritania Total -5 -1 0 2 2 -3 7 -1 2 1 -1
Mauritius Long-term resident -36 -51 -66 -66 -40 -50 -41 -64 -43 -55 -49
Mauritius Long-term visitor 3051 674 -69 62 250 244 531 595 609 580 669
Mauritius Settler 518 272 206 293 309 209 211 150 146 127 74
Mauritius Short-term resident -234 -200 -245 -215 -160 -285 -156 -275 -217 -243 -176
Mauritius Short-term visitor -618 -298 26 121 146 185 67 165 31 27 -203
Mauritius Total 2681 397 -148 195 505 303 612 571 526 435 315
Mexico Long-term resident -39 -61 -26 -37 -34 -68 -31 -51 -31 -56 -39
Mexico Long-term visitor 386 431 516 575 544 595 559 635 632 657 871
Mexico Settler 208 190 149 201 167 113 95 115 103 77 85
Mexico Short-term resident -122 -32 -147 -262 -37 -6 -209 -98 -255 -98 -185
Mexico Short-term visitor -121 -209 -171 -187 -170 -278 -9 -29 111 -291 208
Mexico Total 312 319 321 290 470 356 405 572 560 289 940
Micronesia, Federated States of Long-term resident 0 0 0 0 0 0 0 -3 0 -1 -1
Micronesia, Federated States of Long-term visitor -9 1 -9 -2 0 9 5 -13 -5 1 -16
Micronesia, Federated States of Settler 0 1 0 0 0 1 3 0 1 0 0
Micronesia, Federated States of Short-term resident -20 -15 -10 -10 -7 -9 -23 -6 -3 -19 -11
Micronesia, Federated States of Short-term visitor 2 29 -9 40 -1 -5 15 8 2 9 27
Micronesia, Federated States of Total -27 16 -28 28 -8 -4 0 -14 -5 -11 -1
Moldova Long-term resident -4 -1 -5 -1 -2 5 0 -1 1 -2 -5
Moldova Long-term visitor 0 6 17 15 15 9 23 1 12 5 5
Moldova Settler 16 19 27 38 21 12 15 20 22 13 10
Moldova Short-term resident -9 -11 -14 -5 -19 -20 -19 -5 -12 -21 6
Moldova Short-term visitor 14 -3 6 7 39 11 7 7 17 17 31
Moldova Total 17 10 31 54 54 17 26 22 40 12 47
Monaco Long-term resident -1 0 0 0 -1 0 -1 0 -1 0 0
Monaco Long-term visitor 2 3 3 2 1 3 1 0 -1 0 1
Monaco Settler 0 0 0 0 0 0 0 0 0 0 0
Monaco Short-term resident 0 1 -1 -1 2 -2 1 -1 2 -2 0
Monaco Short-term visitor -7 3 -5 -4 -5 -5 4 -6 0 -1 3
Monaco Total -6 7 -3 -3 -3 -4 5 -7 0 -3 4
Mongolia Long-term resident -10 -2 -6 -11 -18 -15 -9 -10 -9 0 -7
Mongolia Long-term visitor 185 104 143 137 188 311 491 687 723 623 855
Mongolia Settler 32 29 25 28 17 26 12 14 15 19 23
Mongolia Short-term resident -8 -39 -41 -11 -15 -39 -33 -13 -50 -16 -38
Mongolia Short-term visitor 21 -34 -19 4 -94 -15 -13 79 388 519 694
Mongolia Total 220 58 102 147 78 268 448 757 1067 1145 1527
Montenegro Long-term resident 0 -1 0 -4 0 -1 -2 -1 -1 -2 -2
Montenegro Long-term visitor 2 -1 0 1 6 1 8 10 9 6 13
Montenegro Settler 6 9 11 14 10 16 17 11 7 6 6
Montenegro Short-term resident -9 -2 -1 -5 -8 -4 -10 0 -2 -20 8
Montenegro Short-term visitor 37 28 27 29 38 54 71 87 65 81 73
Montenegro Total 36 33 37 35 46 66 84 107 78 71 98
Morocco Long-term resident -10 -2 1 1 -8 -5 -3 -12 -9 -9 -11
Morocco Long-term visitor 31 30 48 42 60 42 56 62 63 47 79
Morocco Settler 40 38 59 45 74 64 65 57 49 62 60
Morocco Short-term resident -32 -65 -28 -72 -43 -71 -34 -79 -19 -29 -57
Morocco Short-term visitor 20 11 -20 -25 31 2 -1 41 3 -6 -21
Morocco Total 49 12 60 -9 114 32 83 69 87 65 50
Mozambique Long-term resident 0 -1 -1 0 -1 -4 1 -1 -2 0 -2
Mozambique Long-term visitor 18 9 29 19 30 19 37 35 45 34 55
Mozambique Settler 3 12 4 5 5 20 2 2 5 2 8
Mozambique Short-term resident -2 -7 -11 5 -1 -7 -1 -13 6 -4 -4
Mozambique Short-term visitor -2 -17 -9 -5 -27 -36 -17 -25 -29 -15 -40
Mozambique Total 17 -4 12 24 6 -8 22 -2 25 17 17
Myanmar, The Republic of the Union of Long-term resident -37 -45 -19 -93 -29 -68 -67 -76 -38 -63 -70
Myanmar, The Republic of the Union of Long-term visitor 519 554 470 523 578 626 688 777 840 889 1165
Myanmar, The Republic of the Union of Settler 2932 2458 1492 2360 2170 2267 2379 2218 2045 1766 2405
Myanmar, The Republic of the Union of Short-term resident -110 -106 -107 -84 -90 -199 -100 -185 -206 -87 -203
Myanmar, The Republic of the Union of Short-term visitor 101 43 -75 -147 -67 -10 -92 -177 -80 -149 139
Myanmar, The Republic of the Union of Total 3405 2904 1761 2559 2562 2616 2808 2557 2561 2356 3436
Namibia Long-term resident -3 1 -6 -1 -2 1 -1 -2 -6 -9 -2
Namibia Long-term visitor 34 14 21 29 51 25 27 15 8 8 21
Namibia Settler 10 21 24 13 14 5 5 7 9 10 11
Namibia Short-term resident -22 -10 1 -5 -4 -8 -6 -6 -11 -4 -4
Namibia Short-term visitor -3 -19 -8 -18 -24 -25 -19 -4 1 0 8
Namibia Total 16 7 32 18 35 -2 6 10 1 5 34
Nauru Long-term resident -2 -6 -1 -3 -7 -4 -2 -6 1 -1 1
Nauru Long-term visitor -12 17 -1 9 1 -6 15 -7 -2 -32 -4
Nauru Settler 6 3 0 5 8 2 1 3 3 0 1
Nauru Short-term resident -8 -54 -22 7 -24 9 -82 -59 -9 -7 -7
Nauru Short-term visitor -44 63 -40 -7 -54 291 -325 -2 91 -77 -100
Nauru Total -60 23 -64 11 -76 291 -393 -71 84 -117 -109
Nepal Long-term resident -50 -75 -94 -154 -128 -109 -161 -94 -149 -210 -120
Nepal Long-term visitor 9915 857 -1230 -123 1556 5927 4936 6130 12250 18666 18984
Nepal Settler 621 676 562 821 913 952 1031 985 1111 811 738
Nepal Short-term resident -295 -156 129 -123 -255 -478 -225 -609 -1113 -860 -717
Nepal Short-term visitor 871 1057 997 1300 1361 1276 1474 1914 2659 3521 5335
Nepal Total 11063 2359 364 1721 3446 7568 7055 8326 14758 21928 24220
Netherlands Long-term resident -324 -362 -339 -284 -269 -327 -306 -306 -283 -309 -292
Netherlands Long-term visitor 1497 1342 1581 1741 2002 1569 1267 1287 1380 1701 1683
Netherlands Settler 534 433 305 388 375 257 247 200 181 132 120
Netherlands Short-term resident -716 -576 -325 -237 -214 -257 -783 -755 -680 -348 -662
Netherlands Short-term visitor -918 -876 -386 -842 -1178 -955 483 46 270 -874 -1002
Netherlands Total 72 -40 836 766 716 287 908 472 868 302 -153
New Zealand Long-term resident -2127 -2277 -1733 -1218 -1134 -2770 -3061 -3213 1991 1213 848
New Zealand Long-term visitor 11681 9340 11060 12219 10382 7277 6323 5872 5801 5980 6123
New Zealand Settler 33184 24512 34739 44656 41432 27367 22399 19708 12552 14385 14150
New Zealand Short-term resident 12558 14095 13355 12993 17052 18351 15645 18654 38721 33298 40313
New Zealand Short-term visitor -28410 -27540 -23574 -20033 -42259 -41850 -38031 -35788 -55332 -47693 -57346
New Zealand Total 26886 18129 33847 48618 25473 8375 3276 5233 3733 7183 4088
Nicaragua Long-term resident -2 0 0 0 -1 -1 1 0 -4 0 0
Nicaragua Long-term visitor -1 1 -1 -4 4 10 3 0 -4 4 3
Nicaragua Settler 3 2 3 9 7 6 1 7 5 4 2
Nicaragua Short-term resident -1 0 1 -3 -2 2 -5 0 0 -4 -1
Nicaragua Short-term visitor 6 12 2 35 13 13 2 8 20 11 22
Nicaragua Total 5 15 5 37 21 30 2 15 17 15 26
Niger Long-term resident 0 0 0 0 0 0 0 0 0 0 0
Niger Long-term visitor 3 2 0 1 2 4 3 4 3 0 4
Niger Settler 2 0 1 0 0 0 0 1 4 0 0
Niger Short-term resident 0 0 0 0 0 0 0 0 0 0 -1
Niger Short-term visitor 1 -1 -2 2 -8 -6 -4 -7 -2 2 -2
Niger Total 6 1 -1 3 -6 -2 -1 -2 5 2 1
Nigeria Long-term resident -26 -14 -15 -41 -5 -28 -19 -31 -13 -14 -36
Nigeria Long-term visitor 244 256 307 319 513 637 721 1043 1238 765 718
Nigeria Settler 247 270 192 232 253 241 251 291 340 358 333
Nigeria Short-term resident -56 -69 -30 -61 -59 -48 -50 -46 -63 -106 -80
Nigeria Short-term visitor 96 129 -48 113 13 111 110 127 210 95 -18
Nigeria Total 505 572 406 562 715 913 1013 1384 1712 1098 917
Norway Long-term resident -90 -108 -104 -90 -102 -106 -114 -102 -99 -79 -88
Norway Long-term visitor 885 1041 1026 1066 887 747 663 667 662 748 681
Norway Settler 54 60 50 62 49 51 42 45 28 21 20
Norway Short-term resident -238 -185 -160 -156 -146 -203 -224 -90 -107 -200 -167
Norway Short-term visitor -700 -633 -725 -885 -467 -499 -437 -526 -320 -349 -593
Norway Total -89 175 87 -3 221 -10 -70 -7 163 141 -148
Not Stated Long-term resident -7 -7 -8 -29 -34 -34 -15 -8 -18 -11 -12
Not Stated Long-term visitor 8 -40 -90 -105 -67 -80 -72 -36 -28 -51 -53
Not Stated Settler 285 467 311 180 135 194 373 185 270 173 282
Not Stated Short-term resident 281 349 240 267 420 516 379 258 190 -82 -37
Not Stated Short-term visitor 747 853 629 467 393 292 315 325 284 168 109
Not Stated Total 1314 1622 1082 780 847 888 980 724 698 197 289
Oman Long-term resident -3 0 -5 -3 -4 -6 -4 -13 -2 -7 -10
Oman Long-term visitor 487 510 437 397 504 628 777 834 920 856 792
Oman Settler 11 5 3 2 2 4 18 3 12 6 5
Oman Short-term resident -16 -10 -11 -19 -18 -36 -28 -23 -13 0 7
Oman Short-term visitor -561 -490 -457 -411 -560 -556 -765 -760 -808 -872 -747
Oman Total -82 15 -33 -34 -76 34 -2 41 108 -17 47
Pakistan Long-term resident -204 -210 -174 -415 -350 -709 -1071 -1095 -1041 -904 -486
Pakistan Long-term visitor 2287 2304 2257 2785 4342 4227 4384 4318 4110 5802 6699
Pakistan Settler 1559 1573 1398 2887 2512 4320 5839 4774 4923 4825 3441
Pakistan Short-term resident -380 -389 -410 -387 -509 -736 -1606 -981 -938 -498 -454
Pakistan Short-term visitor 271 672 503 555 -254 235 -741 108 -224 -998 -1273
Pakistan Total 3533 3950 3574 5425 5741 7337 6805 7123 6830 8227 7927
Palau Long-term resident 0 0 0 0 0 -1 0 -1 -1 0 -2
Palau Long-term visitor 1 0 -6 -1 0 0 0 1 0 0 -1
Palau Settler 0 0 0 0 0 0 0 0 0 0 0
Palau Short-term resident 0 -2 -2 -1 1 0 0 1 0 0 2
Palau Short-term visitor -7 6 13 -1 1 -3 1 7 -3 -2 6
Palau Total -6 4 5 -3 2 -4 1 8 -4 -2 5
Panama Long-term resident -1 -4 -1 -1 -1 -1 -4 -1 0 1 -1
Panama Long-term visitor 5 5 3 -1 11 18 0 -5 12 11 9
Panama Settler 6 2 2 1 4 1 4 3 2 1 5
Panama Short-term resident -2 2 -2 -2 -8 0 -1 2 1 -5 -7
Panama Short-term visitor 4 14 -13 8 6 10 8 15 22 28 28
Panama Total 12 19 -11 5 12 28 7 14 37 36 34
Papua New Guinea Long-term resident -60 -62 -81 -58 -83 -50 -46 -26 -51 -48 -48
Papua New Guinea Long-term visitor 1199 991 1057 1220 1517 1161 866 965 795 604 579
Papua New Guinea Settler 185 130 203 226 134 113 103 91 92 85 55
Papua New Guinea Short-term resident -677 -713 -800 -876 -828 -961 -988 -837 -762 -814 -758
Papua New Guinea Short-term visitor -6 -79 93 398 24 -79 188 377 14 -142 353
Papua New Guinea Total 642 267 471 909 764 184 123 569 87 -316 181
Paraguay Long-term resident -1 1 -2 -1 0 0 0 0 -1 -2 -3
Paraguay Long-term visitor 9 9 1 11 6 11 10 3 67 33 36
Paraguay Settler 7 11 0 3 5 0 0 3 3 4 1
Paraguay Short-term resident -5 -1 0 0 -4 0 -4 -8 -14 -5 4
Paraguay Short-term visitor -12 20 -14 -5 0 -4 13 -16 6 -22 -5
Paraguay Total -2 40 -15 8 7 7 19 -18 61 8 33
Peru Long-term resident -33 -45 -26 -55 -37 -43 -14 -26 -26 -25 -29
Peru Long-term visitor 310 140 1 28 183 124 165 109 138 273 352
Peru Settler 243 202 155 157 123 94 80 79 77 81 44
Peru Short-term resident -88 -186 -123 -188 -110 -73 -198 -143 -33 -232 -164
Peru Short-term visitor 305 308 268 233 175 194 204 213 183 364 367
Peru Total 737 419 275 175 334 296 237 232 339 461 569
Philippines Long-term resident -335 -597 -596 -585 -681 -518 -523 -393 -575 -550 -489
Philippines Long-term visitor 11317 7471 7782 9724 12581 11531 9440 7888 8158 8702 14467
Philippines Settler 5613 5572 4600 6419 6165 6037 6487 6329 5780 4702 3661
Philippines Short-term resident -1655 -1657 -2172 -2322 -1797 -2170 -2694 -3150 -3148 -4314 -4592
Philippines Short-term visitor 3101 4605 7462 8917 7169 7336 10309 13217 16650 16228 16476
Philippines Total 18041 15394 17076 22153 23437 22216 23019 23892 26866 24768 29522
Poland Long-term resident -49 -74 -64 -59 -76 -61 -74 -80 -74 -77 -56
Poland Long-term visitor 537 437 305 500 621 692 560 707 816 898 951
Poland Settler 268 259 241 285 231 222 184 173 165 131 97
Poland Short-term resident -233 -231 -155 -335 -124 -238 -276 -434 -422 -312 -297
Poland Short-term visitor 231 311 163 501 234 333 673 273 434 37 -176
Poland Total 754 702 490 891 885 948 1066 639 919 678 519
Portugal Long-term resident -39 -47 -54 -61 -37 -49 -48 -36 -61 -44 -68
Portugal Long-term visitor 366 295 364 410 420 447 302 374 391 441 522
Portugal Settler 74 107 90 131 135 123 98 107 92 65 55
Portugal Short-term resident -66 -210 -64 -185 -132 -201 -133 -227 -272 -192 -133
Portugal Short-term visitor 46 79 -40 157 182 26 127 220 149 -31 -67
Portugal Total 382 224 295 452 568 345 346 438 299 239 310
Qatar Long-term resident 1 -1 -1 1 1 0 -1 -1 -3 -2 1
Qatar Long-term visitor 45 37 28 31 64 68 47 18 8 34 53
Qatar Settler 1 1 0 1 2 3 1 2 1 1 0
Qatar Short-term resident -3 3 1 1 -2 -2 2 -2 -1 -4 0
Qatar Short-term visitor -39 -32 35 -14 -181 -76 -69 -31 -19 20 1
Qatar Total 5 8 63 20 -116 -7 -20 -14 -14 49 55
Romania Long-term resident -39 -35 -34 -50 -27 -31 -36 -59 -25 -43 -24
Romania Long-term visitor 112 136 91 160 210 230 183 153 132 194 224
Romania Settler 217 200 136 189 189 172 148 145 115 63 54
Romania Short-term resident -155 -129 -58 -148 -34 -120 -40 26 -120 -135 -16
Romania Short-term visitor 288 323 151 361 239 308 342 277 454 454 332
Romania Total 423 495 286 512 577 559 597 542 556 533 570
Russian Federation Long-term resident -121 -139 -178 -224 -239 -213 -187 -228 -171 -223 -180
Russian Federation Long-term visitor 687 758 975 1330 1531 1413 1224 1067 1173 1205 1232
Russian Federation Settler 1014 892 874 932 1111 863 840 666 733 678 475
Russian Federation Short-term resident -417 -544 -310 -474 -704 -716 -509 -702 -726 -719 -826
Russian Federation Short-term visitor -29 395 66 139 200 60 107 255 456 492 555
Russian Federation Total 1134 1362 1427 1703 1899 1406 1474 1058 1465 1433 1256
Rwanda Long-term resident -2 -2 1 -1 -4 0 -1 0 0 -1 -3
Rwanda Long-term visitor 5 11 16 10 19 37 32 -3 8 4 5
Rwanda Settler 66 139 71 46 41 35 22 65 50 44 49
Rwanda Short-term resident 3 -1 -3 2 3 7 -5 1 0 0 1
Rwanda Short-term visitor 6 6 4 -4 11 -4 14 1 1 13 2
Rwanda Total 78 153 89 53 70 75 62 64 59 60 54
Samoa Long-term resident -10 0 -9 -11 -12 0 -6 -7 -6 -8 -6
Samoa Long-term visitor 36 30 53 21 64 81 21 14 47 5 36
Samoa Settler 51 71 48 51 51 43 41 30 22 15 18
Samoa Short-term resident -52 -10 9 -133 -14 7 -58 -24 8 -69 -71
Samoa Short-term visitor -149 12 -22 59 51 7 83 131 114 253 151
Samoa Total -124 103 79 -13 140 138 81 144 185 196 128
San Marino Long-term resident 0 0 0 0 0 0 0 0 0 0 0
San Marino Long-term visitor 0 0 0 0 1 0 0 1 1 0 0
San Marino Settler 0 0 0 0 0 0 0 0 0 0 0
San Marino Short-term resident 0 0 0 0 0 0 0 0 0 0 0
San Marino Short-term visitor 0 2 -4 3 0 -2 -2 2 -1 -1 0
San Marino Total 0 2 -4 3 1 -2 -2 3 0 -1 0
Saudi Arabia Long-term resident -5 0 -12 -3 0 -10 -9 -14 -17 -18 -18
Saudi Arabia Long-term visitor 8884 9712 8409 7430 6521 6491 6545 5465 4501 4462 5746
Saudi Arabia Settler 20 21 18 11 30 35 40 32 29 61 30
Saudi Arabia Short-term resident -19 4 4 -19 -68 13 13 16 -25 -63 64
Saudi Arabia Short-term visitor -5955 -8698 -8682 -7593 -7371 -7202 -6912 -7147 -5238 -4701 -4388
Saudi Arabia Total 2925 1039 -263 -174 -888 -673 -323 -1648 -750 -259 1434
Senegal Long-term resident -1 -1 -1 -3 -4 -1 0 -2 -3 1 0
Senegal Long-term visitor 0 4 1 4 -3 0 3 0 -2 5 8
Senegal Settler 7 7 7 7 8 6 2 8 7 1 1
Senegal Short-term resident -5 -1 0 0 0 -3 0 2 -1 -4 -1
Senegal Short-term visitor 5 -1 3 4 -2 2 -3 1 5 -2 4
Senegal Total 6 8 10 12 -1 4 2 9 6 1 12
Serbia Long-term resident -9 -43 -26 -28 -52 -30 -27 -34 -20 -45 -17
Serbia Long-term visitor 99 71 71 155 156 125 165 85 126 125 161
Serbia Settler 214 232 192 192 198 227 162 170 173 142 103
Serbia Short-term resident -83 -56 -95 -58 -31 -77 -101 -98 -122 -112 -70
Serbia Short-term visitor 101 120 21 80 232 249 173 310 355 299 222
Serbia Total 322 324 163 341 503 494 372 433 512 409 399
Seychelles Long-term resident -12 -6 -8 -4 -3 0 -3 -1 -2 -5 -5
Seychelles Long-term visitor 29 -1 24 29 18 28 28 11 32 21 35
Seychelles Settler 17 21 18 30 9 20 10 7 10 4 1
Seychelles Short-term resident -36 -3 -13 -17 -12 -19 -25 -2 -44 -7 -21
Seychelles Short-term visitor 2 -9 -19 16 -19 -30 -3 -38 10 -34 8
Seychelles Total 0 2 2 54 -7 -1 7 -23 6 -21 18
Sierra Leone Long-term resident -2 -3 -1 -3 -2 -7 0 -2 -10 -1 -5
Sierra Leone Long-term visitor -8 1 11 8 20 15 3 -5 21 9 7
Sierra Leone Settler 211 462 153 145 90 95 45 28 97 48 25
Sierra Leone Short-term resident -2 -1 -4 2 -7 4 3 -4 -4 -9 -1
Sierra Leone Short-term visitor 28 11 11 9 2 3 7 8 12 111 -4
Sierra Leone Total 227 470 170 161 103 110 58 25 116 158 22
Singapore Long-term resident -1285 -1136 -1112 -1074 -1118 -1113 -896 -877 -964 -845 -696
Singapore Long-term visitor 4641 4747 4997 4844 5256 4928 4539 4131 5140 5175 5263
Singapore Settler 1271 1242 795 1144 1211 1137 1227 992 972 767 596
Singapore Short-term resident -3401 -2615 -2791 -3308 -2379 -3403 -2726 -4030 -3346 -2131 -2872
Singapore Short-term visitor 791 -30 -886 1842 -1279 -395 -759 -1696 -721 -4138 -2900
Singapore Total 2017 2208 1003 3448 1691 1154 1385 -1479 1081 -1172 -609
Sint Maarten (Dutch part) Long-term resident 0 0 0 0 0 0 0 0 0 0 0
Sint Maarten (Dutch part) Long-term visitor 0 0 0 0 0 0 0 -1 0 1 0
Sint Maarten (Dutch part) Settler 0 0 0 0 0 0 0 0 0 0 0
Sint Maarten (Dutch part) Short-term resident 0 0 0 0 0 0 0 0 0 0 0
Sint Maarten (Dutch part) Short-term visitor 0 1 0 1 0 0 0 0 0 0 1
Sint Maarten (Dutch part) Total 0 1 0 1 0 0 0 -1 0 1 1
Slovakia Long-term resident -17 -13 -13 -27 -22 -33 -24 -28 -29 -33 -36
Slovakia Long-term visitor 232 229 276 264 358 333 346 355 375 381 370
Slovakia Settler 55 62 51 40 67 37 59 42 27 27 14
Slovakia Short-term resident -197 -68 -143 -42 -33 -58 -87 -155 -111 33 -91
Slovakia Short-term visitor -32 -68 -47 -117 -141 -140 -82 -101 -53 -366 -226
Slovakia Total 41 142 124 118 229 139 212 113 209 42 31
Slovenia Long-term resident -13 -7 -6 4 -3 -8 -5 -8 1 -5 -13
Slovenia Long-term visitor 31 13 22 39 58 71 78 74 77 81 85
Slovenia Settler 55 23 26 52 32 56 18 20 9 7 6
Slovenia Short-term resident -66 -23 -29 -31 -61 -46 -35 -21 15 -38 -29
Slovenia Short-term visitor -3 66 -5 -1 71 42 24 -12 -34 21 -16
Slovenia Total 4 72 8 63 97 115 80 52 68 66 33
Solomon Islands Long-term resident -20 -31 -21 -25 -25 -28 -15 -16 -26 -22 -17
Solomon Islands Long-term visitor 80 56 96 65 109 67 49 80 73 70 23
Solomon Islands Settler 18 19 23 28 36 21 17 33 12 20 10
Solomon Islands Short-term resident -18 -34 -66 -85 -69 39 39 -166 -41 -173 -167
Solomon Islands Short-term visitor -37 -31 36 114 92 -125 -10 226 -43 138 239
Solomon Islands Total 23 -21 68 97 143 -26 80 157 -25 33 88
Somalia Long-term resident -1 -2 1 -7 -8 -4 -6 -7 -4 -4 -16
Somalia Long-term visitor 3 -3 4 5 -3 4 3 7 19 12 31
Somalia Settler 420 662 369 346 292 521 503 678 238 187 102
Somalia Short-term resident -11 -2 -6 -7 12 2 11 -9 -9 -13 -5
Somalia Short-term visitor 19 1 6 8 16 14 20 54 22 20 61
Somalia Total 430 656 374 345 309 537 531 723 266 202 173
South Africa Long-term resident -1103 -1815 -1650 -1932 -1336 -1085 -767 -366 -557 -519 -266
South Africa Long-term visitor 11766 5066 5391 5634 4777 2979 2491 2491 3332 3393 4622
South Africa Settler 6276 6325 3684 4745 3275 2530 2554 2195 3218 2770 2079
South Africa Short-term resident -2515 -2584 -1353 -2180 -1113 -1056 -1402 -1511 -1253 -908 -935
South Africa Short-term visitor -2552 -1771 -2077 -190 -970 -435 877 1505 -112 18 -561
South Africa Total 11872 5221 3995 6077 4633 2933 3753 4314 4628 4754 4939
South Sudan Long-term resident 0 0 0 0 0 1 5 1 -3 0 -8
South Sudan Long-term visitor 0 0 0 1 3 -1 8 2 3 4 2
South Sudan Settler 0 0 0 10 112 151 401 282 519 248 121
South Sudan Short-term resident 0 0 0 0 1 6 -18 -39 -4 -26 -30
South Sudan Short-term visitor 0 0 0 0 4 -4 35 34 28 15 34
South Sudan Total 0 0 0 11 120 153 431 280 543 241 119
Spain Long-term resident -84 -75 -65 -81 -90 -81 -104 -136 -119 -136 -114
Spain Long-term visitor 458 558 716 1164 1663 1512 1648 1752 1988 2362 2637
Spain Settler 123 110 123 165 188 174 151 144 98 86 83
Spain Short-term resident -42 -72 -31 -154 -77 -248 -254 -233 -328 -399 -357
Spain Short-term visitor -237 -168 -369 -85 -447 -569 -760 -566 -1090 -620 -1740
Spain Total 218 353 374 1009 1237 788 681 961 549 1293 509
Sri Lanka Long-term resident -399 -759 -494 -726 -443 -519 -440 -333 -315 -240 -208
Sri Lanka Long-term visitor 4188 2603 2060 2464 3400 3271 3905 3871 5479 6705 8267
Sri Lanka Settler 3916 4314 3015 4067 3223 2942 2620 2451 2080 1784 1708
Sri Lanka Short-term resident -655 -611 -665 -1206 -769 -1201 -575 -1614 -1310 -1267 -1077
Sri Lanka Short-term visitor -947 -102 -854 191 593 -173 -513 -11 71 -835 -1644
Sri Lanka Total 6103 5445 3062 4791 6003 4320 4997 4364 6005 6147 7046
St Kitts and Nevis Long-term resident 0 0 0 0 0 -2 -2 -2 -7 -5 -3
St Kitts and Nevis Long-term visitor -1 0 0 4 4 0 0 2 3 4 0
St Kitts and Nevis Settler 0 0 2 0 1 1 1 1 5 1 4
St Kitts and Nevis Short-term resident -3 -1 -3 0 -1 -3 -11 -14 -4 -4 -4
St Kitts and Nevis Short-term visitor 4 2 2 4 0 -2 16 16 2 8 6
St Kitts and Nevis Total 0 1 1 8 4 -6 4 3 -1 4 3
St Lucia Long-term resident -1 0 0 -2 0 -1 0 0 3 0 0
St Lucia Long-term visitor 4 -2 -2 3 2 2 -3 2 -2 1 1
St Lucia Settler 0 0 3 6 2 0 0 1 0 0 1
St Lucia Short-term resident 0 0 -2 -2 1 1 -1 -1 1 -2 -2
St Lucia Short-term visitor 9 6 1 20 18 0 28 18 19 39 45
St Lucia Total 12 4 0 25 23 2 24 20 21 38 45
St Vincent and the Grenadines Long-term resident 0 0 -1 1 0 0 0 -1 0 0 0
St Vincent and the Grenadines Long-term visitor 1 -1 0 1 5 5 2 3 -2 0 -1
St Vincent and the Grenadines Settler 0 1 1 0 0 1 1 1 1 0 1
St Vincent and the Grenadines Short-term resident 0 0 0 -1 0 0 -2 2 0 -1 0
St Vincent and the Grenadines Short-term visitor 11 5 6 26 12 8 6 7 15 18 22
St Vincent and the Grenadines Total 12 5 6 27 17 14 7 12 14 17 22
Sudan Long-term resident -26 -20 -26 -15 -46 -31 -29 -2 -16 -18 -25
Sudan Long-term visitor 24 7 16 16 48 41 62 77 56 108 122
Sudan Settler 1073 786 685 404 466 273 192 191 125 177 87
Sudan Short-term resident -54 -57 -88 -6 -27 -57 -61 -72 -30 -67 -27
Sudan Short-term visitor 41 3 63 33 47 78 28 60 37 12 25
Sudan Total 1058 719 650 432 488 304 192 254 172 212 182
Suriname Long-term resident 2 0 0 -1 0 0 -1 0 0 0 0
Suriname Long-term visitor -1 4 4 6 16 2 0 -4 7 10 6
Suriname Settler 2 1 0 0 4 1 0 0 0 0 0
Suriname Short-term resident -1 1 -1 0 1 0 1 -1 0 0 0
Suriname Short-term visitor -2 -1 3 -4 -10 -1 0 2 1 -9 -9
Suriname Total 0 5 6 1 11 2 0 -3 8 1 -3
Swaziland Long-term resident 1 0 0 -1 0 0 0 0 0 0 0
Swaziland Long-term visitor 14 5 8 10 12 19 20 2 3 9 8
Swaziland Settler 5 0 0 0 0 0 0 0 0 0 1
Swaziland Short-term resident -3 0 -1 2 0 -6 0 0 0 -1 0
Swaziland Short-term visitor 14 -8 -4 -6 -3 -19 -14 -19 -9 12 -2
Swaziland Total 31 -3 3 5 9 -6 6 -17 -6 20 7
Sweden Long-term resident -200 -162 -114 -173 -195 -171 -159 -171 -176 -161 -148
Sweden Long-term visitor 1136 953 935 1009 1022 1081 908 778 898 1027 1001
Sweden Settler 201 153 120 190 165 170 120 120 105 79 66
Sweden Short-term resident -248 -386 -383 -224 -231 -330 -370 -568 -420 -652 -491
Sweden Short-term visitor -740 -203 -288 -60 -56 -494 51 59 -305 -232 -472
Sweden Total 149 354 269 743 705 256 550 218 102 61 -45
Switzerland Long-term resident -103 -90 -105 -78 -111 -91 -64 -69 -80 -88 -90
Switzerland Long-term visitor 628 552 529 600 468 428 485 466 517 505 581
Switzerland Settler 155 139 105 124 110 93 68 71 72 48 59
Switzerland Short-term resident -188 -324 -301 -194 -176 -295 -149 -195 -114 -349 -131
Switzerland Short-term visitor -49 -407 -364 -327 -225 -342 78 -284 -415 -317 -519
Switzerland Total 443 -130 -136 124 65 -207 419 -11 -19 -201 -100
Syria Long-term resident -14 -19 -13 -4 -1 -29 -19 -40 -43 -80 -63
Syria Long-term visitor 40 47 58 58 74 92 72 84 83 95 72
Syria Settler 213 163 206 234 191 950 2628 2254 8617 3299 2292
Syria Short-term resident -92 -39 -10 -65 -38 -102 -133 -152 -124 -163 -147
Syria Short-term visitor 91 -23 -30 -14 42 88 80 73 77 -10 117
Syria Total 238 129 211 209 268 999 2628 2219 8610 3141 2271
Taiwan Long-term resident -255 -253 -247 -223 -192 -249 -243 -202 -207 -212 -197
Taiwan Long-term visitor 3146 2834 2623 3555 4614 2201 -270 718 428 1351 202
Taiwan Settler 455 436 374 315 278 274 289 270 248 246 235
Taiwan Short-term resident -1122 -1517 -1341 -1030 -1341 -865 -1154 -1682 -1947 -1825 -2165
Taiwan Short-term visitor -145 420 1831 4874 7504 -601 1030 2258 3556 3099 1352
Taiwan Total 2078 1921 3240 7491 10863 760 -349 1362 2078 2659 -572
Tajikistan Long-term resident -1 -2 1 2 -1 1 -1 0 -1 0 0
Tajikistan Long-term visitor 3 0 3 1 2 3 4 3 -2 3 22
Tajikistan Settler 5 2 6 3 4 8 0 1 0 7 1
Tajikistan Short-term resident 1 -4 1 -4 -3 -2 -6 1 -3 2 -2
Tajikistan Short-term visitor 2 4 8 1 -3 3 2 3 -5 -1 -14
Tajikistan Total 10 0 19 3 -1 13 -1 8 -11 11 7
Tanzania Long-term resident -7 -9 -12 -8 -4 -4 -9 -8 -7 -4 0
Tanzania Long-term visitor 96 91 73 100 97 71 84 55 82 79 86
Tanzania Settler 32 30 25 24 26 38 32 40 57 35 20
Tanzania Short-term resident -55 -21 -41 -36 -45 -55 -11 -34 -64 -36 -25
Tanzania Short-term visitor -30 -32 -44 -3 2 -26 -35 -52 -5 -30 -43
Tanzania Total 36 59 1 77 76 24 61 1 63 44 38
Thailand Long-term resident -359 -413 -382 -480 -431 -411 -424 -349 -375 -436 -429
Thailand Long-term visitor 4849 4038 3137 3424 4978 5940 6422 6002 5090 3665 3501
Thailand Settler 1758 1692 1644 1676 1900 1719 1576 1773 1612 1395 1404
Thailand Short-term resident -2198 -2646 -2819 -2663 -3407 -3044 -3105 -3691 -3550 -3243 -3064
Thailand Short-term visitor 233 313 -389 126 746 1291 -376 1414 1235 263 531
Thailand Total 4283 2984 1191 2082 3786 5496 4093 5149 4012 1644 1943
Timor-Leste Long-term resident -7 0 -10 -6 -8 -8 -8 -20 -2 -5 -1
Timor-Leste Long-term visitor 86 95 157 238 221 246 203 130 147 146 222
Timor-Leste Settler 27 20 24 21 14 28 7 11 9 4 11
Timor-Leste Short-term resident -31 -23 -25 -26 -37 -60 -64 -44 -70 -58 -65
Timor-Leste Short-term visitor -85 -10 -73 -163 -193 -119 -140 -82 51 35 -119
Timor-Leste Total -10 82 73 64 -3 87 -2 -5 135 122 48
Togo Long-term resident 0 1 -1 -1 0 -1 0 0 0 -1 0
Togo Long-term visitor 0 1 -6 0 4 2 0 -3 -1 -1 0
Togo Settler 57 66 76 15 7 17 1 2 2 0 6
Togo Short-term resident -2 -1 5 -2 2 0 -1 0 -1 0 0
Togo Short-term visitor 7 -3 2 3 1 -2 0 -1 3 1 0
Togo Total 62 64 76 15 14 16 0 -2 3 -1 6
Tonga Long-term resident -14 -26 -19 -22 -9 -27 -17 -27 -31 -25 -23
Tonga Long-term visitor 62 32 44 -9 6 5 -66 -127 -82 -85 -39
Tonga Settler 139 127 115 119 87 90 64 55 92 60 50
Tonga Short-term resident -194 -241 -210 -260 -154 -237 -322 -218 -137 -102 -32
Tonga Short-term visitor 24 579 973 649 294 718 891 698 341 721 535
Tonga Total 17 471 903 477 224 549 549 381 183 568 491
Trinidad and Tobago Long-term resident 1 -2 0 -6 -1 -3 1 -3 -10 -4 1
Trinidad and Tobago Long-term visitor 64 40 87 75 110 131 44 20 22 29 33
Trinidad and Tobago Settler 7 9 5 19 22 15 10 8 7 5 3
Trinidad and Tobago Short-term resident -27 -56 -85 -28 -40 -75 -70 -99 -12 -18 -80
Trinidad and Tobago Short-term visitor -26 -29 22 -48 -42 -45 -30 33 -25 -4 38
Trinidad and Tobago Total 19 -38 29 12 49 23 -45 -41 -18 8 -5
Tunisia Long-term resident -3 -2 0 -3 -1 -5 -3 -3 -8 -5 -1
Tunisia Long-term visitor 5 7 29 33 27 34 33 25 21 22 18
Tunisia Settler 4 7 11 11 22 25 21 15 13 22 20
Tunisia Short-term resident -2 -4 -1 -5 -4 -11 -5 -17 -17 -14 -3
Tunisia Short-term visitor 8 19 -30 -21 -12 -16 -17 -17 15 1 10
Tunisia Total 12 27 9 15 32 27 29 3 24 26 44
Turkey Long-term resident -66 -97 -97 -113 -105 -94 -110 -71 -96 -104 -110
Turkey Long-term visitor 513 628 428 381 558 633 361 418 570 664 588
Turkey Settler 444 346 467 422 315 367 312 338 342 337 326
Turkey Short-term resident -204 -167 -125 -164 -37 -291 -173 -237 -137 -238 -127
Turkey Short-term visitor 176 303 -336 -63 -68 187 67 276 297 232 154
Turkey Total 863 1013 337 463 662 802 457 724 976 892 831
Turkmenistan Long-term resident -2 -1 1 0 1 0 -1 0 0 1 -1
Turkmenistan Long-term visitor 6 3 4 0 -1 8 9 4 1 5 3
Turkmenistan Settler 1 2 2 0 2 0 0 2 1 0 3
Turkmenistan Short-term resident 0 -1 -5 -2 2 1 1 -5 -4 0 -5
Turkmenistan Short-term visitor 2 3 0 -2 4 -6 -8 0 10 0 -1
Turkmenistan Total 7 6 2 -4 8 3 1 1 8 6 -1
Tuvalu Long-term resident -3 0 1 -3 -1 2 1 0 0 -2 -2
Tuvalu Long-term visitor 4 -14 -1 -1 15 3 8 6 6 14 50
Tuvalu Settler 0 15 0 5 0 0 0 1 0 0 0
Tuvalu Short-term resident -17 -21 -13 -14 0 -7 -23 -22 -5 -22 -2
Tuvalu Short-term visitor 48 6 -2 21 -22 25 -5 -2 4 13 -19
Tuvalu Total 32 -14 -15 8 -8 23 -19 -17 5 3 27
Uganda Long-term resident -1 -3 -2 -9 -9 -6 -3 -5 1 -5 -2
Uganda Long-term visitor 61 37 49 66 94 80 68 101 98 78 101
Uganda Settler 33 53 70 40 42 63 60 64 35 75 39
Uganda Short-term resident -29 -24 -30 -44 -38 -36 -47 -33 -22 -68 -9
Uganda Short-term visitor -27 4 -1 1 31 -50 56 -22 -29 61 -84
Uganda Total 37 67 86 53 120 51 133 105 83 141 45
Ukraine Long-term resident -41 -46 -53 -57 -75 -38 -29 -55 -72 -63 -70
Ukraine Long-term visitor 173 152 205 212 333 339 334 208 265 303 274
Ukraine Settler 279 281 300 286 313 265 314 273 303 251 210
Ukraine Short-term resident -193 -199 -133 -231 -250 -44 -154 -331 -187 -230 -212
Ukraine Short-term visitor 660 721 934 1022 1084 998 897 1005 1020 907 1138
Ukraine Total 878 909 1253 1232 1405 1520 1362 1100 1329 1168 1340
United Arab Emirates Long-term resident -5 1 -4 -4 -1 -1 -3 -3 -7 -2 -2
United Arab Emirates Long-term visitor 1239 1352 1112 831 586 485 298 373 361 371 422
United Arab Emirates Settler 3 8 7 3 5 10 14 17 13 10 8
United Arab Emirates Short-term resident 0 -13 -4 -11 0 -2 -11 -11 -19 -18 -11
United Arab Emirates Short-term visitor -1546 -743 -1164 -1009 -1248 -835 -381 -336 -100 -469 -526
United Arab Emirates Total -309 605 -53 -190 -658 -343 -83 40 247 -108 -110
United Kingdom, Channels Islands and Isle of Man, nfd Long-term resident -6733 -6867 -5668 -6817 -5298 -5057 -4624 -4361 -4178 -4387 -3990
United Kingdom, Channels Islands and Isle of Man, nfd Long-term visitor 30094 25471 31839 42173 45321 33359 26790 22511 24419 25822 25331
United Kingdom, Channels Islands and Isle of Man, nfd Settler 21562 15451 10428 16072 11041 9028 8039 6607 5932 4749 4113
United Kingdom, Channels Islands and Isle of Man, nfd Short-term resident -10414 -11568 -7187 -10296 -9081 -10086 -9145 -11799 -12072 -12081 -11917
United Kingdom, Channels Islands and Isle of Man, nfd Short-term visitor -6224 -8825 -8959 -12767 995 -33460 -9593 -6737 -5550 -10068 -11864
United Kingdom, Channels Islands and Isle of Man, nfd Total 28285 13662 20453 28365 42978 -6216 11467 6222 8551 4035 1672
United States of America Long-term resident -1059 -1292 -1144 -1214 -1270 -1253 -1281 -1799 -2001 -2068 -2097
United States of America Long-term visitor 9146 9184 12190 15431 15330 12793 10450 9789 9663 9361 9187
United States of America Settler 1343 1463 1370 1454 1542 1332 1270 1165 1019 905 1092
United States of America Short-term resident -3098 -3241 -3176 -3062 -3537 -3335 -3499 -7013 -8177 -8252 -8593
United States of America Short-term visitor -4616 -2941 -6521 -7665 -10173 -8943 -941 -7598 -7591 -15753 -19808
United States of America Total 1716 3173 2719 4944 1892 594 5999 -5456 -7087 -15807 -20219
Uruguay Long-term resident 0 -6 -11 2 -10 -6 -2 -8 -6 -3 -3
Uruguay Long-term visitor 10 8 0 22 18 40 14 54 47 66 122
Uruguay Settler 27 13 21 29 11 17 12 10 13 6 15
Uruguay Short-term resident -44 3 -35 -27 -54 4 -25 -42 -13 -39 -33
Uruguay Short-term visitor 19 9 11 42 37 -25 8 74 37 27 65
Uruguay Total 12 27 -14 68 2 30 7 88 78 57 166
Uzbekistan Long-term resident -5 -15 -9 -15 -9 -4 -17 -18 -25 -5 -20
Uzbekistan Long-term visitor 60 45 49 36 29 73 62 67 81 74 110
Uzbekistan Settler 60 50 48 69 52 66 53 58 41 34 15
Uzbekistan Short-term resident -25 -29 -20 -6 -15 -7 -14 -10 -18 -58 8
Uzbekistan Short-term visitor 18 -1 -7 -6 5 -21 -1 -10 -17 -6 -20
Uzbekistan Total 108 50 61 78 62 107 83 87 62 39 93
Vanuatu Long-term resident -15 -14 -12 -19 -11 -7 -9 -15 -13 -8 -9
Vanuatu Long-term visitor 16 69 28 47 55 18 27 58 38 71 135
Vanuatu Settler 11 29 18 22 20 7 9 8 8 4 16
Vanuatu Short-term resident -251 -28 -174 -158 -203 -220 -115 -232 -71 -57 -196
Vanuatu Short-term visitor 118 125 374 271 311 264 221 370 571 662 1218
Vanuatu Total -121 181 234 163 172 62 133 189 533 672 1164
Venezuela, Bolivarian Republic of Long-term resident -46 -39 -27 -42 -22 -31 -9 -13 -10 -8 -1
Venezuela, Bolivarian Republic of Long-term visitor 182 253 293 293 343 374 429 476 338 -24 36
Venezuela, Bolivarian Republic of Settler 247 337 189 246 183 73 82 76 62 50 26
Venezuela, Bolivarian Republic of Short-term resident -67 -62 -70 -46 -76 -9 -44 -42 -50 -74 -76
Venezuela, Bolivarian Republic of Short-term visitor -28 96 33 -112 -70 -51 81 127 212 -18 186
Venezuela, Bolivarian Republic of Total 288 585 418 339 358 356 539 623 552 -74 171
Vietnam Long-term resident -222 -318 -277 -314 -305 -453 -287 -345 -365 -466 -602
Vietnam Long-term visitor 9965 9603 7839 7846 10248 11229 9791 10319 11847 13201 15219
Vietnam Settler 2729 2834 3072 3279 3429 3217 2916 3278 3082 3031 2671
Vietnam Short-term resident -1255 -1559 -1786 -2298 -2377 -2679 -3044 -4151 -5132 -5661 -6745
Vietnam Short-term visitor -2964 -4316 -6023 -3653 -2774 -2631 -1911 -1336 -1356 -3108 -3560
Vietnam Total 8254 6244 2826 4860 8221 8683 7465 7765 8076 6997 6983
Western Sahara Long-term resident 0 0 0 0 0 0 0 0 0 0 0
Western Sahara Long-term visitor 0 0 0 0 0 0 0 0 0 0 0
Western Sahara Settler 0 0 0 0 0 0 0 0 0 0 0
Western Sahara Short-term resident 0 0 0 0 0 0 0 0 0 0 0
Western Sahara Short-term visitor 0 0 0 0 0 0 0 0 0 0 -1
Western Sahara Total 0 0 0 0 0 0 0 0 0 0 -1
Yemen Long-term resident -2 -1 1 -5 -5 0 -1 -6 -10 -1 -6
Yemen Long-term visitor 28 30 33 27 48 33 21 18 59 98 127
Yemen Settler 11 3 7 9 8 6 28 37 35 27 32
Yemen Short-term resident 2 1 -5 -7 -10 0 -12 -8 -19 -12 -8
Yemen Short-term visitor -4 -23 -28 -14 -18 -26 -9 1 5 -11 -9
Yemen Total 35 10 8 10 23 13 27 42 70 101 136
Zambia Long-term resident -4 -8 -13 -15 -16 -9 -15 -9 -1 -10 -15
Zambia Long-term visitor 249 191 79 144 195 145 56 18 86 67 122
Zambia Settler 35 42 57 38 62 41 30 32 25 19 25
Zambia Short-term resident -84 -19 -53 -74 -39 -29 -24 -10 20 -29 -28
Zambia Short-term visitor -81 -90 5 32 -70 -75 -17 4 -28 3 -36
Zambia Total 115 116 75 125 132 73 30 35 102 50 68
Zimbabwe Long-term resident -71 -115 -111 -107 -59 -75 -63 -41 -49 -28 -74
Zimbabwe Long-term visitor 1691 591 298 404 479 377 446 557 629 488 660
Zimbabwe Settler 584 612 410 402 366 308 318 373 524 400 387
Zimbabwe Short-term resident -120 -139 -39 -106 -71 -117 -88 -119 -188 -101 -74
Zimbabwe Short-term visitor -100 -140 -66 74 -11 174 115 161 124 -24 78
Zimbabwe Total 1984 809 492 667 704 667 728 931 1040 735 977
Whitepaper
Our whitepaper explains how your business may be affected by the illegal worker legislation.