The TSS Visa One Year On

The TSS (Temporary Skills Shortage) visa replaced the 457 visa in March 2018, so is now over one year old.
As we now have 12 months of data on TSS visa grants, this article looks at the trends we can see in terms of overall numbers, occupation, location and citizenship of applicants.
The descriptions below compare the numbers of 457 visas granted from July 2017 to June 2018 (last year of operation) to the numbers of TSS visas granted between April 2018 and March 2019 (the first full year of operation).
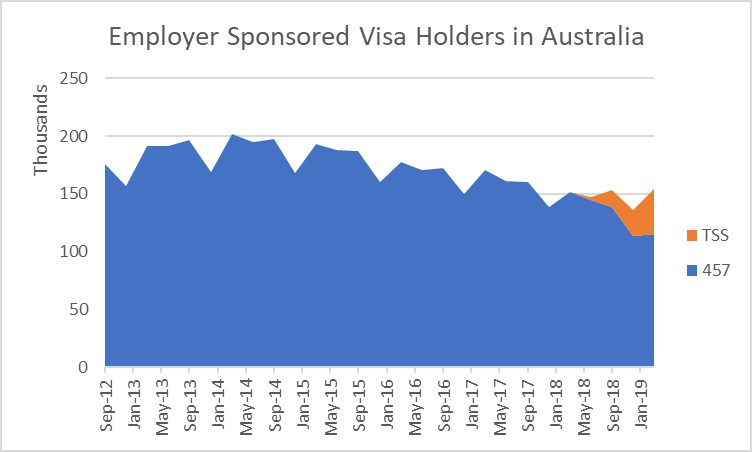
1. Employers are Still Sponsoring Staff
Whilst it appeared that the TSS visa would be less attractive to employers – for example due to the increased cost and labour market testing requirements – the number of sponsored employees in Australia has been stable.
In March 2018, there were 151,596 temporary employer sponsored visa holders in Australia. In March 2019, there were 154,205 – a slight increase. Numbers are well down on a high of over 200,000 in March 2014, but the decline started well before the introduction of the TSS.
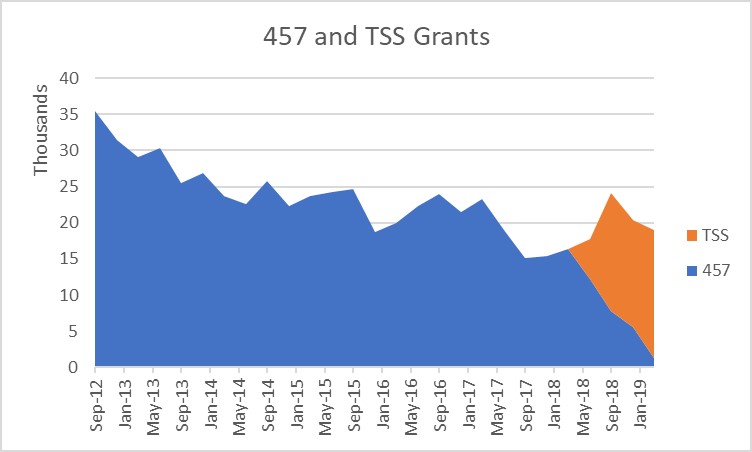
Grant numbers of TSS have largely backfilled for the phasing out of the 457:
2. Strong Declines in Hospitality and HR Professionals Occupations
When looking at the most popular occupations for the 457 visa, we can see a big change between the first full year of TSS (April 2018 to March 2019) versus the last full year of the 457 (July 2017 to June 2018).
We see a massive drop off in the number of visas granted to food trades such as cooks and chefs, restaurant managers and HR professionals.
Most other occupational categories have been relatively static, but we do see IT occupations such as programmers and network/support professionals increasing their share, as well as engineers.
457 and TSS Visa Grants by Occupational Category
| Occupations | 457 (Jul-17 to Jun-18) | TSS (Apr-18 to Mar-19) | 457 Rank | TSS Rank | Rank Change |
| 2613 Software and Applications Programmers | 3615 | 4012 | 1 | 1 | 0 |
| 2531 General Practitioners and Resident Medical Officers | 2091 | 1434 | 2 | 3 | -1 |
| 2611 ICT Business and Systems Analysts | 1528 | 1780 | 3 | 2 | 1 |
| 3514 Cooks | 1324 | 451 | 4 | 15 | -11 |
| 2421 University Lecturers and Tutors | 1193 | 920 | 5 | 5 | 0 |
| 3513 Chefs | 1101 | 609 | 6 | 11 | -5 |
| 2544 Registered Nurses | 1028 | 931 | 7 | 4 | 3 |
| 1411 Cafe and Restaurant Managers | 1009 | 294 | 8 | 22 | -14 |
| 2247 Management and Organisation Analysts | 878 | 860 | 9 | 6 | 3 |
| 2251 Advertising and Marketing Professionals | 871 | 683 | 10 | 9 | 1 |
| 2211 Accountants | 855 | 692 | 11 | 8 | 3 |
| 3212 Motor Mechanics | 795 | 634 | 12 | 10 | 2 |
| 2632 ICT Support and Test Engineers | 783 | 730 | 13 | 7 | 6 |
| 2231 Human Resource Professionals | 557 | 199 | 14 | 31 | -17 |
| 1351 ICT Managers | 488 | 498 | 15 | 13 | 2 |
3. Sydney and Melbourne Increase their Overall Share by Location
Overall, we see little movement in the distribution of TSS visa approvals by region – Sydney and Melbourne have slightly increased their share of visas granted:
TSS and 457 Visa Grants by Location
| Location | 457 | TSS | 457 Share | TSS Share | Change |
| Greater Sydney | 23,371 | 22,116 | 39.7% | 40.4% | 0.7% |
| Greater Melbourne | 14,276 | 13,773 | 24.2% | 25.1% | 0.9% |
| Greater Perth | 4,897 | 4,316 | 8.3% | 7.9% | -0.4% |
| Greater Brisbane | 3,895 | 3,424 | 6.6% | 6.2% | -0.4% |
| Rest of Qld | 2,904 | 2,523 | 4.9% | 4.6% | -0.3% |
| Rest of NSW | 2,667 | 2,268 | 4.5% | 4.1% | -0.4% |
| Greater Adelaide | 1,597 | 1,226 | 2.7% | 2.2% | -0.5% |
| Rest of Vic. | 1,537 | 1,608 | 2.6% | 2.9% | 0.3% |
| Rest of WA | 1,046 | 771 | 1.8% | 1.4% | -0.4% |
| Australian Capital Territory | 924 | 811 | 1.6% | 1.5% | -0.1% |
| Greater Darwin | 611 | 301 | 1.0% | 0.5% | -0.5% |
| Rest of SA | 355 | 194 | 0.6% | 0.4% | -0.2% |
| Rest of NT | 312 | 251 | 0.5% | 0.5% | -0.1% |
| Rest of Tas. | 198 | 248 | 0.3% | 0.5% | 0.1% |
| Greater Hobart | 186 | 206 | 0.3% | 0.4% | 0.1% |
| Not Specified | 111 | 379 | 0.2% | 0.7% | 0.5% |
| Other Territories | 13 | 379 | 0.0% | 0.7% | 0.7% |
| Total | 58,900 | 54,794 | 0.0% | 0.0% | 0.0% |
4. Some Increases in DAMA Regional TSS Visas
A number of initiatives have been announced encouraging sponsorship of TSS visas by regional employers – for example new Designated Area Migration Agreements (DAMAs) in The Goldfields (WA), Great South Coast (VIC), Adelaide City and Regional SA, Orana (NSW) and Far North Queensland.
Looking at TSS grants in these DAMA areas, we can see numbers in the Great South Coast and Orana increasing off a low base, but most other areas have actually declined since the introduction of the TSS visa:
TSS and 457 Visa Grants for DAMA Regions
| DAMA Area | 457 | TSS | Change |
| Greater Adelaide | 1,597 | 1,226 | -371 |
| Darwin | 611 | 301 | -310 |
| Cairns | 312 | 234 | -78 |
| Northern Territory – Outback | 312 | 251 | -61 |
| Western Australia – Outback (South) | 241 | 229 | -12 |
| South Australia – South East | 231 | 94 | -137 |
| Warrnambool and South West | 202 | 300 | 98 |
| Far West and Orana | 160 | 237 | 77 |
| South Australia – Outback | 88 | 73 | -15 |
| Barossa – Yorke – Mid North | 36 | 27 | -9 |
| Total | 3,790 | 2,972 | -818 |
5. Declines for most Nationalities, Apart from India and South Africa
We have seen some changes in the mix of citizenship of TSS holders versus 457 holders. Looking at the main source countries, we see declines of more than 20% in the number of people from China, France, Canada, Italy, South Korea, Malaysia, Malaysia and Nepal. Numbers from India and South Africa increased significantly though.
Top 20 Citizenship Countries for 457 and TSS Grants
| Citizenship | 457 | TSS | Difference | Percent Change |
| India | 14,632 | 16,138 | 1,506 | 10.3% |
| United Kingdom | 8,913 | 7,986 | -927 | -10.4% |
| Philippines | 3,747 | 3,424 | -323 | -8.6% |
| United States of America | 2,785 | 2,666 | -119 | -4.3% |
| China, Peoples Republic of (excl SARs) | 3,152 | 2,316 | -836 | -26.5% |
| South Africa | 1,639 | 2,114 | 475 | 29.0% |
| Ireland, Republic of | 1,910 | 2,021 | 111 | 5.8% |
| France | 1,578 | 1,348 | -230 | -14.6% |
| Japan | 1,215 | 1,221 | 6 | 0.5% |
| Canada | 1,252 | 926 | -326 | -26.0% |
| Italy | 1,251 | 926 | -325 | -26.0% |
| Brazil | 1,031 | 910 | -121 | -11.7% |
| Korea, South | 1,457 | 842 | -615 | -42.2% |
| Vietnam | 807 | 777 | -30 | -3.7% |
| Germany, Fed Republic of | 890 | 770 | -120 | -13.5% |
| Sri Lanka | 700 | 626 | -74 | -10.6% |
| Malaysia | 864 | 595 | -269 | -31.1% |
| Spain | 614 | 593 | -21 | -3.4% |
| Netherlands, Kingdom of The | 655 | 557 | -98 | -15.0% |
| Nepal | 819 | 448 | -371 | -45.3% |
Conclusions
Overall, the abolition of the 457 program has made less impact in overall temporary employer sponsored visa numbers than expected.
However, when looking more closely at the numbers, we see the following trends:
- Occupation: Significant reduction in hospitality and HR occupations
- Location: Sydney and Melbourne increased their share of grants, but some growth in grants for certain DAMA regions
- Nationality: Reduction in numbers from most traditional source countries, apart from India and South Africa