Which Visa Types Contribute Most to Net Overseas Migration?

Migration makes a significant impact on Australia’s population, with more than 28% of people living in Australia having been born overseas.
Australia has one of the most rigorous permanent migration programs in the world – very selective and subject to an annual cap for each visa type.
However, the permanent migration program is only part of the story. The number of temporary residents in Australia has increased significantly in the last decade, and they do not form part of the migration program.
This article looks at the main visa types which have contributed to Net Overseas Migration (NOM) in the last 10 years.
Temporary Versus Permanent Entry
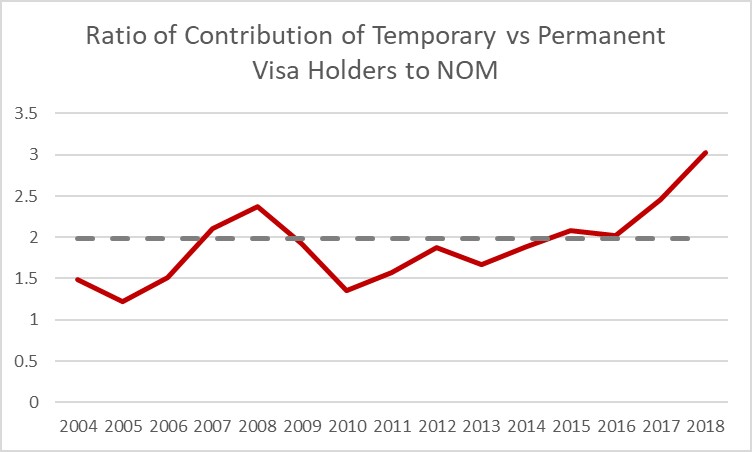
Overall, the increase in the Australian population due to migration was 2.18 million from January 2009 to December 2018. Of this increase, 1.4 million was due to arrivals of temporary visa holders, versus 704,000 arrivals of permanent visa holders. So temporary visa holders have contributed to Net Overseas Migration twice as much as traditional migrants with permanent visas.
In recent years, this trend has accelerated, with the ratio rising to 3 to 1 in Calendar Year 2018, and with cuts announced to the permanent migration program, this is likely to continue.
Australian and New Zealand Citizens
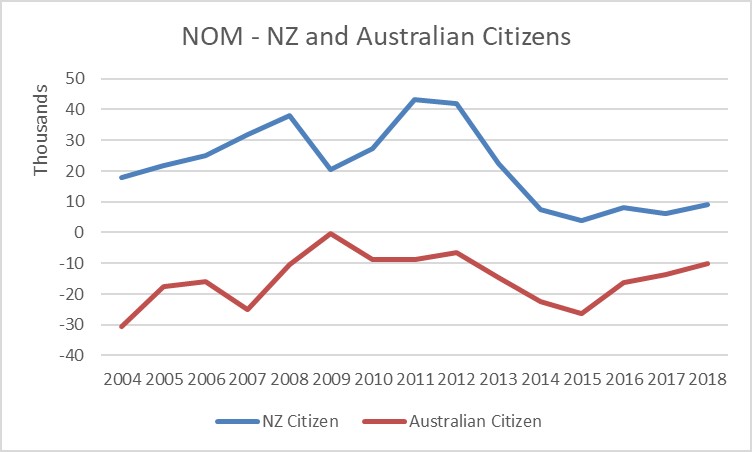
In general, there is a net outflow of Australians each year, and is largely balanced by New Zealanders settling in Australia. Overall, from 2009 to 2018, there was a loss of approximately 128,000 Australian citizens departing, versus a net gain of 189,000 NZ citizens. In 2009, the net outflow of Australians was minimal. Since 2012 the net inflow of NZ citizens has slowed considerably.
Types of Permanent Visas
When looking at the contribution of the various permanent visa types to Net Overseas Migration, it is interesting to compare this to Migration Program numbers. The Migration Program is set each year and sets a maximum number of permanent visas to be granted in each migration stream.
Looking at Net Overseas Migration from 2009-2018, skilled migrants contributed 46% to the total number of permanent resident additions, versus 62% of the migration program. Family sponsored migrants contributed 38% to NOM, but represented only 30% of the migration program. Humanitarian and Special eligibility represented only 8% of the migration program, but contributed 17% to NOM. What can explain these mis-matches?
When we look at the proportion of departures in a visa category versus arrivals in a visa category (call it the “departure rate”), this effect is partly explained. Humanitarian entrants had a departure rate of around 1% – that is almost everyone settling in this program remained in Australia. Skilled migrants on the other hand had a departure rate of around 20% – meaning that 1 in 5 arrivals on average depart Australia permanently. Family migrants had a departure rate of 18%.
This would indicate that skilled migrants tend to travel worldwide to where their skills are most in demand, even if they arrive in Australia on a permanent visa. Humanitarian entrants, on the other hand, tend to stay in Australia once they arrive. Given that they are typically fleeing persecution in their home country, this makes sense. It would also justify government funding for settlement assistance as they tend to remain in the Australian community longer than skilled or family sponsored visa holders.
In terms of family-sponsored migrants making a higher contribution than skilled migrants, this is possibly explained by a higher proportion of skilled migrants applying onshore. For instance, many employer sponsored migrants apply onshore after having worked for several years in Australia.
Permanent Visas – Contribution to NOM
| Stream | Arrivals (‘000) | Departures (‘000) | Net (‘000) | NOM Share | Migration Program (‘000) | Share | Departure Rate |
| Family | 323 | 57 | 266 | 37.8% | 584 | 29.8% | 17.6% |
| Skill | 408 | 81 | 327 | 46.4% | 1211 | 61.9% | 19.9% |
| Humanitarian/Spec Elig | 120 | 1 | 119 | 16.9% | 162 | 8.3% | 0.8% |
| Other permanent visas | 52 | 60 | -8 | -1.1% | 0 | 0.0% | 0.0% |
| Total | 903 | 199 | 704 | 100.0% | 1957 | 100.0% | 22.0% |
Temporary Residence Program
Turning now to temporary residence visa types, we see that international students made up more than half of the temporary residence contribution to NOM.
Despite the intense public scrutiny, temporary employer sponsored visa holders made up only 12% of the contribution to NOM, less than working holiday makers at 20%.
Visitors made up 27% of the contribution. This is difficult to understand as visitors can typically stay only up to 3 months in Australia. This may well be due to an increasing trend of certain visa holders travelling to Australia on visitor visas, then applying onshore for longer stay visas.
The only net outflow was the “Other Temporary Residents” category. This category might represent bridging visas holders who depart Australia having been unsuccessful in their application for further stay in Australia.
Temporary Visas – Contribution to NOM
| Visa Type | Total (‘000) | Share of Temp Res |
| Students | 712 | 50.8% |
| Temporary work skilled (subclass 457) | 174 | 12.4% |
| Visitor | 377 | 26.9% |
| Working Holiday | 274 | 19.6% |
| Other temporary visas | -136 | -9.7% |
| Total | 1401 | 100.0% |
Conclusion
Australia has a tightly managed permanent migration program, but looking at NOM figures for the last 10 years, temporary visa arrivals contribute twice as much to NOM as permanent visa arrivals. In recent years, this has risen to a three times ratio, and with the recent announcement of a cut to the migration program, it would appear that this trend will continue.
Within the permanent migration program, the humanitarian (refugee) program contributes to NOM far in excess of its share of the migration program. This is most likely due to refugees being unlikely to resettle outside Australia, and suggests that resources assisting them settle in Australia are certainly justified given their longer term residence in Australia.
In terms of temporary visas, international students are the most significant contributors to NOM. Surprisingly, visitors are the next most significant contributor, many of whom appear to apply onshore for further visas and so would hold bridging visas whilst awaiting a decision. Temporary employer sponsored visa holders are actually the least significant contributors to NOM.
The above analysis reinforces the view that temporary visa holders are driving population numbers in Australia, and that many of these do not hold employer sponsored visas. Many will have work rights in Australia, so employers need to be vigilant in ensuring that all their staff have appropriate work rights.
Sources
- ABS – 3412.0 – Migration, Australia, 2017-18
- Department of Home Affairs – Migration Program Statistics
- APH – Australia’s Humanitarian Program: a quick guide to the statistics since 1947